Sentiment Analysis Tool
Welcome to part two of the SentiFX Sentiment Analysis Tool instructional guide.
This post will give you an understanding of what each control option does and how you can best utilize the options to create just the perfect analysis for your trading.
This is the second post about our Sentiment Analysis Tool, so if you haven’t yet make sure to check out Part 1. It deals with the techniques to interpret the Analysis Tool, which setups can occur and how you can use those to profit the most.
Time Frames

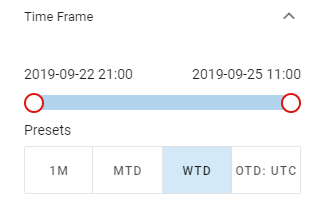
The controls you will utilize the most are the Time Frame options. Remember, the important part about profiting from Sentiment Analysis is not only knowing where Sentiment currently is, but also where it has been before and how quickly the change has taken place. With a range of presets you have the Time Frames providing the most insightful information available at the click of a button. If you are interested in custom ranges, you can easily get whichever you want as well by adjusting the slider directly.
The slider and the two dates above it tell you exactly which Time Frame you are looking at. As we are looking at change over time, the analysis is based on two snapshots of Sentiment Data. A snapshot describes the positioning of Retail at a given point in time. We have two dates to configure here with the thumbs of the slider, because we are comparing two snapshots.
The first one gives you the timestamp of the point in time we call Reference Point. This is the snapshot we compare against. The amount and speed of change , represented by the Y-Position and size of the bubbles, is measured going forward from that Reference Point.
The second timestamp is the Current Snapshot. The absolute Retail positioning, displayed as the location along the X-Axis, is taken from the snapshot at that point in time.
Did you know: you can also control the slider with the keyboard for even more precision! After dragging the thumb, or simply clicking it, it will be selected, which is shown by a glowing outline. When the thumb is selected, you can use the following keys for control:
- Arrow Up/Down will move the thumb by one time step
- Page Up/Down will move the thumb by ten time steps
- Pos1/End will move the thumb directly to the start/end of the time range
Below the slider under Presets you find a range of predefined Time Frames. Those presets will automatically adjust the slider to show a certain range of time once you click them. All presets take the latest available snapshot as the Current Snapshot, they differ only in the Reference Point. The meaning of abbreviations is as follows:
- 1M – Reference Point is 1 month before Current Snapshot
- MTD – Reference Point is at the beginning of the month
- WTD – Reference Point is at the beginning of the week
- OTD – Reference Point is at a specific market open
- UTC – Midnight UTC
- LON – London Open
- NY – New York Open
- AS – Asian Open
Not only will the slider’s thumbs directly jump to the points in time that belong to the Preset when you click the button, the range of available data will also be limited to the timestamps that fall within the preset’s range. That means when selecting WTD, you can’t go further back in time with the Reference Point than the start of the week. You can go forward though, to look at the change since mid-week for example. This increases the resolution of the slider at shorter Time Frames and gives you more control over the data, letting you get precisely the insights that are most valuable to your Trading.
Parameters

The parameters section offers you the ability to configure the area you consider to be a Strong Sell and Strong Buy via the Signal Threshold. The areas are highlighted by red and blue in the Sentiment Analysis graph. The number defines how high the percentage of buyers or seller needs to be, before your Fresh Entry signal is triggered. A bubble inside either of the Strong Signal areas will be highlighted by a red or blue outline in the Sentiment Analysis Tool for you to see more easily whether the Fresh Entry has triggered yet.
In the future we are planning a service for Members to save their preferred Time Frame and Signal Threshold values to get automatic notifications about Fresh Entry signals, as well as many more of our SentiFX Sentiment setups.

Signal Areas
Filters

The Filters section allows you to choose which pairs are most important for you. By selecting multiple pairs you get the significant advantage of being able to compare current and past Sentiment for a multitude of pairs and pick those that present the highest probability signal. As the bubble size allows you to see which pair of all the selected ones has had the most significant change in the period you are looking at, you can easily filter out the pairs worth your attention.

Leave A Comment