A Member asked a legitimate question:
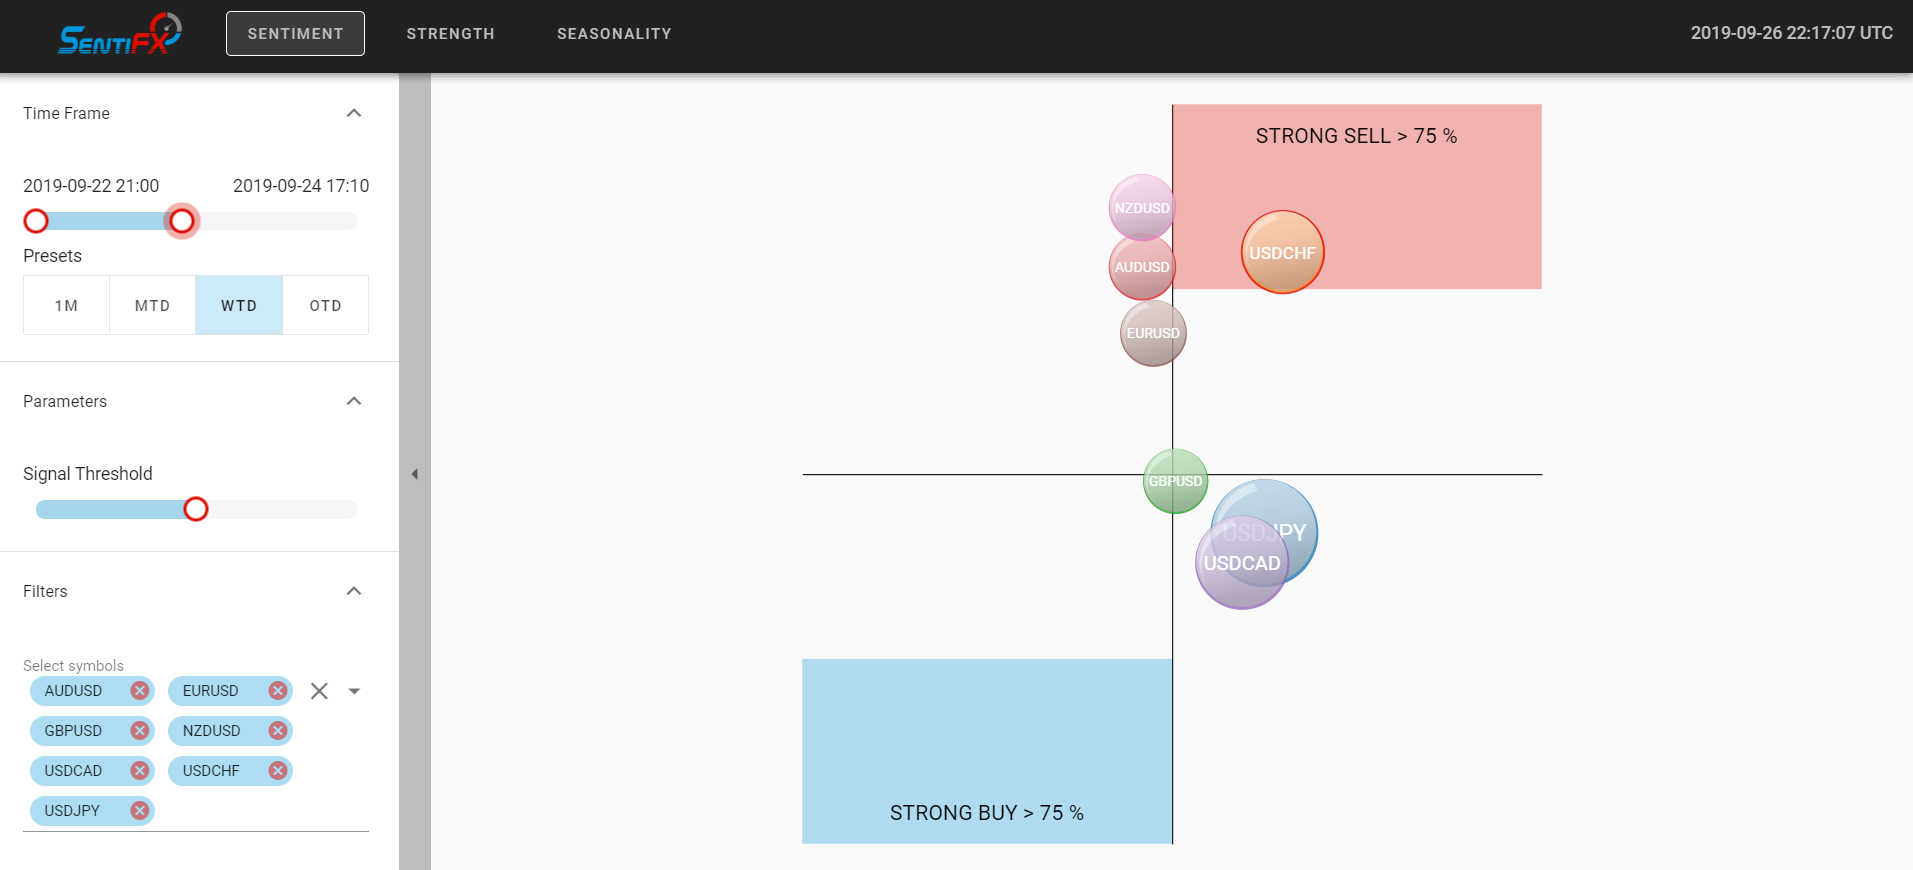
“On 24 September 2019 at 17:20, USDCHF moved into the strong sell mode. Looking at the candle chart, you will be selling at the end of
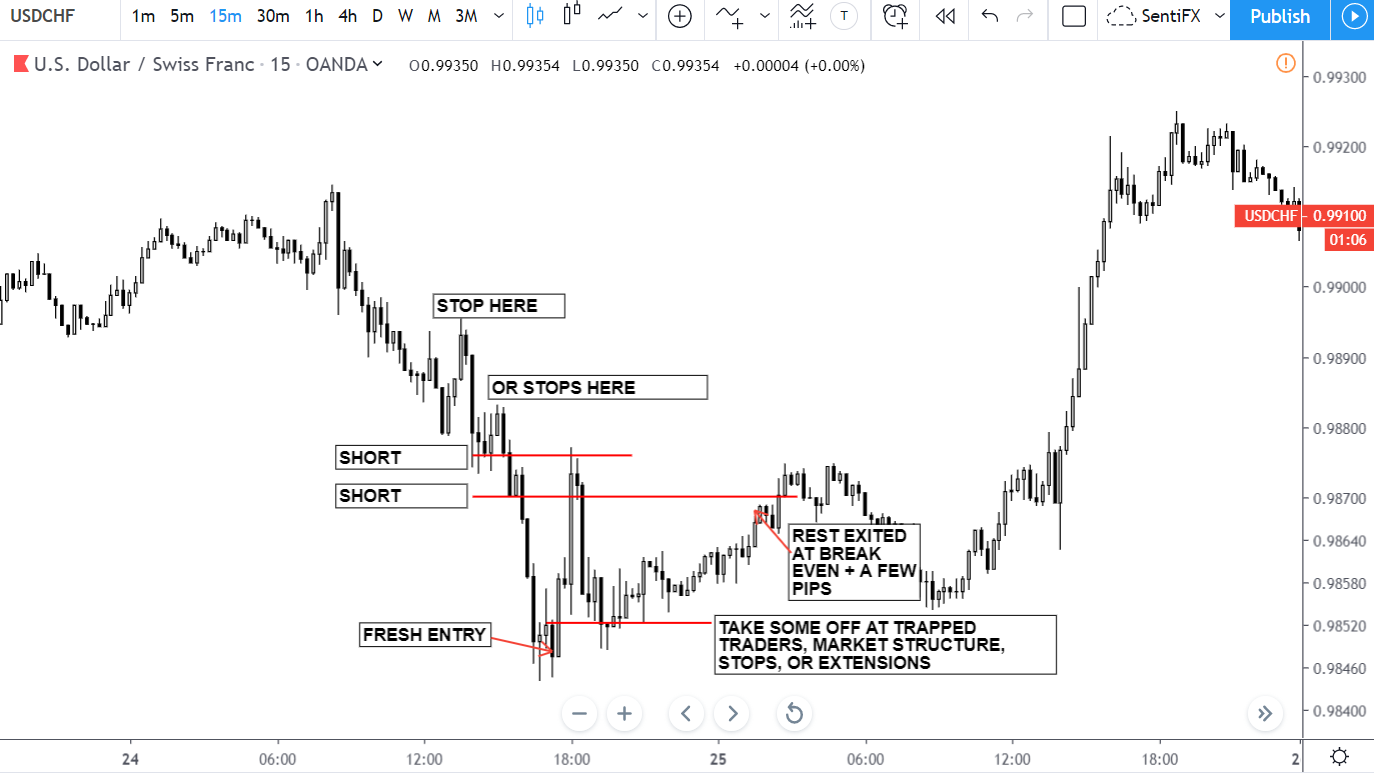
You could have easily made money if you were trading this on the 15M Time Frame, and would have avoided it all together on the 1H Time Frame.
Here is how you’d do it.
This is the 15M chart and analysis:

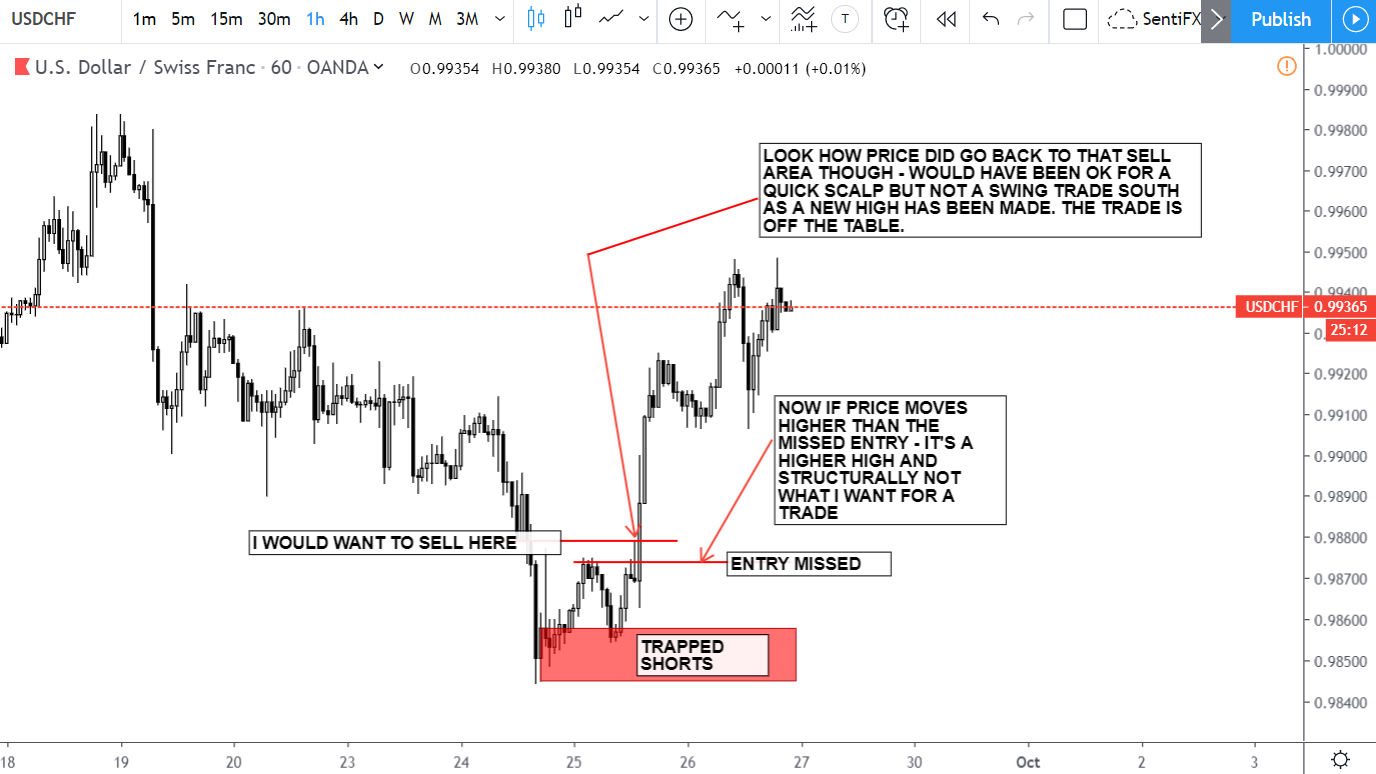
And here is the 1H Time Frame Chart & Analysis:

And this is why I wouldn’t have taken the trade if in front of the computer. If it was a limit order and I was sleeping, then I would have gotten stopped out. Simple as that. It happens – move on.
But if I was watching throughout the day, I would have immediately canceled my limit order after seeing price move down to the trapped shorts area because any move above that would have been a new high so structurally the sell trade would be off at that point.
This is a perfect example how you can use the tool on multiple time frames.
As you can see, if you were trading the 15M chart, you could have easily made money. But on the 1H Time Frame, you would have canceled your order and avoided a loss.
You must….Must…MUST learn Market Structure and Order Flow in combination with Sentiment Signals if you want a strong reading.
They have to ALIGN for highest probability trades.
If ANY of those elements DO NOT – that is your warning signal to stay away from that trade.
And – as always – NO TOOL is a crystal ball into the future. This tool will not guarantee 100% win rate. It can’t. If you’re expecting a crystal ball, no one – no tool – can offer you that. If any of us had that tool – we would be billionaires.
We trade the probabilities, manage risk, and embrace the variance of the results. What we can offer you is high probability trades and that’s what The SentiFX Sentiment Analysis Suite gives you.
It is a tool and like any tool – you have to learn how to use it for consistent profit.
That’s what we’re teaching you how to do here. It will just take some time and practice.
What we have shown repeatedly is how we use it live – week after week to pull money out of the market and in time you will too!
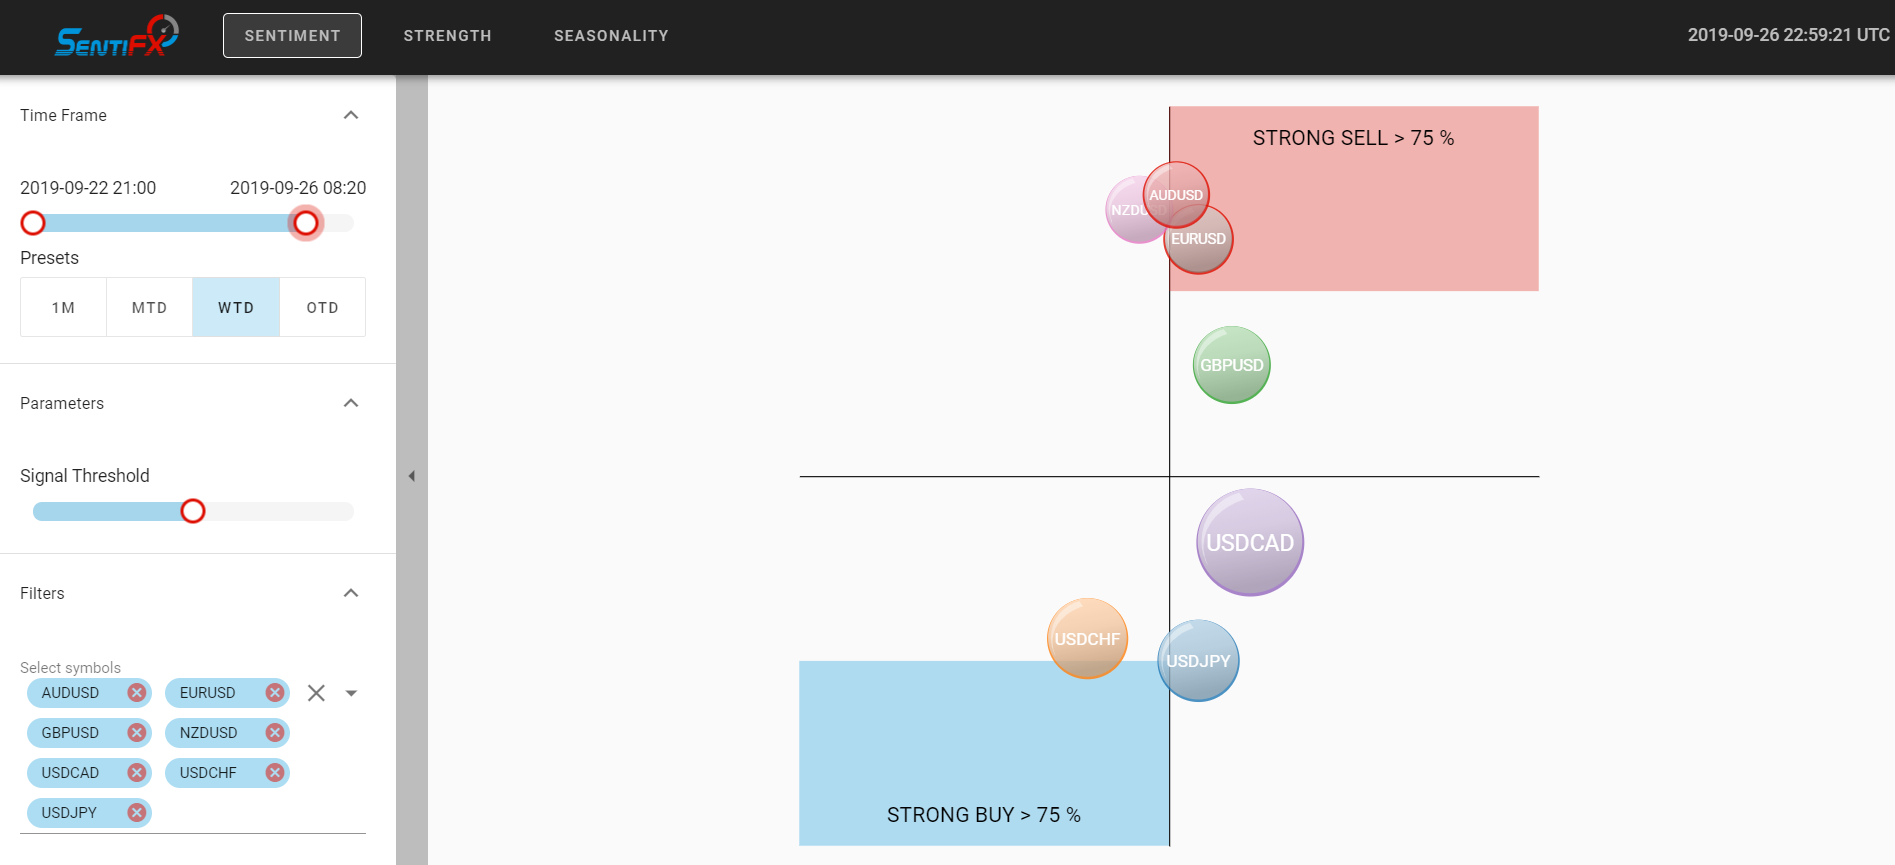
P.S. If you were watching USDCHF Cross both the Y Axis and X Axis and then into the Strong BUY – you could have made a lot of money to the upside. Look at where Sentiment was later on and look at the charts above. $$$$$


Leave A Comment