Strength Analysis Tool
Welcome to the SentiFX Strength Analysis Tool controls instructional guide.
This post will give you an understanding of what each control option does and how you can best utilize the options to create just the perfect analysis for your trading.
Time Frames

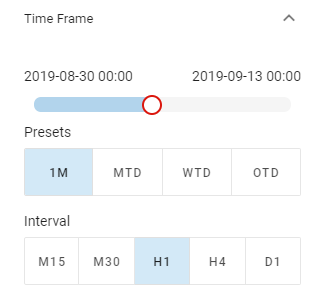
The controls you will utilize the most are the Time Frame options. They allow you to scroll through time and see how the Strength of the different currencies has changed. The dials always show you the Strength of the currencies at the time that is shown at the top right of the slider. Contrary to the Sentiment Analysis, we don’t have a reference point. Therefore the left time displays only how far you can go back for informational purposes, but otherwise does not affect the Strength Analysis.
Because of that, the Time Frame presets as well do not have any influence on the analysis. They only allow you to change the range of available timestamps to look at, so you can get a higher resolution of the slider when you are only interested in the more recent past. Choosing a preset with a shorter time range means fewer data points need to be displayed on a slider of the same length, therefore the distance between data points gets bigger. This allows you to fine-tune the slider more precisely when using the mouse to move the thumb.
Did you know: you can also control the slider with the keyboard for even more precision! After dragging the thumb, or simply clicking it, it will be selected, which is shown by a glowing outline. When the thumb is selected, you can use the following keys for control:
- Arrow Up/Down will move the thumb by one time step
- Page Up/Down will move the thumb by ten time steps
- Pos1/End will move the thumb directly to the start/end of the time range
Below the Presets you will find the Interval controls. Currency Strength can be measured dependent on different period lengths. Since markets are fractal, we might see short term strength in a generally weak market and vice versa. To allow you to leverage the Strength Analysis for your Trading, the period length that Strength is measured over can be configured. If you are interested in short term opportunities, you will want to stick to the lower, minute-based Intervals, while Traders holding positions for multiple days or even weeks would likely want to use the daily measurements.
Be aware though that markets are noisy. The shorter the time frame you select, the more the Strength measurement will move around and it might get harder to interpret the readings. When in doubt, you should stick to the medium to higher time frames.
Parameters

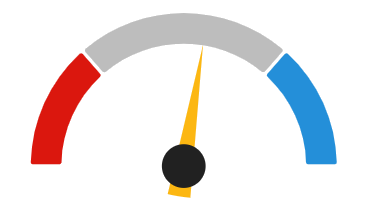
The parameters section offers you the ability to configure the area you consider to be an area of Extreme Strength and Extreme Weakness via the Signal Threshold. The areas are highlighted by red and blue colored arcs in the Strength Analysis graph. The number defines how high or low the Strength reading needs to be, before you consider it to be extreme. A currency that has reached either of the Extreme Signal areas will be highlighted by a red or blue background of the Strength Measurement’s value for you to see more easily whether an extreme condition is reached yet.

Signal Areas
In the future we are planning a service for Members to save their preferred Interval and Signal Threshold values to get automatic notifications about Extreme Strength signals, as well as many more of our SentiFX setups.

Leave A Comment