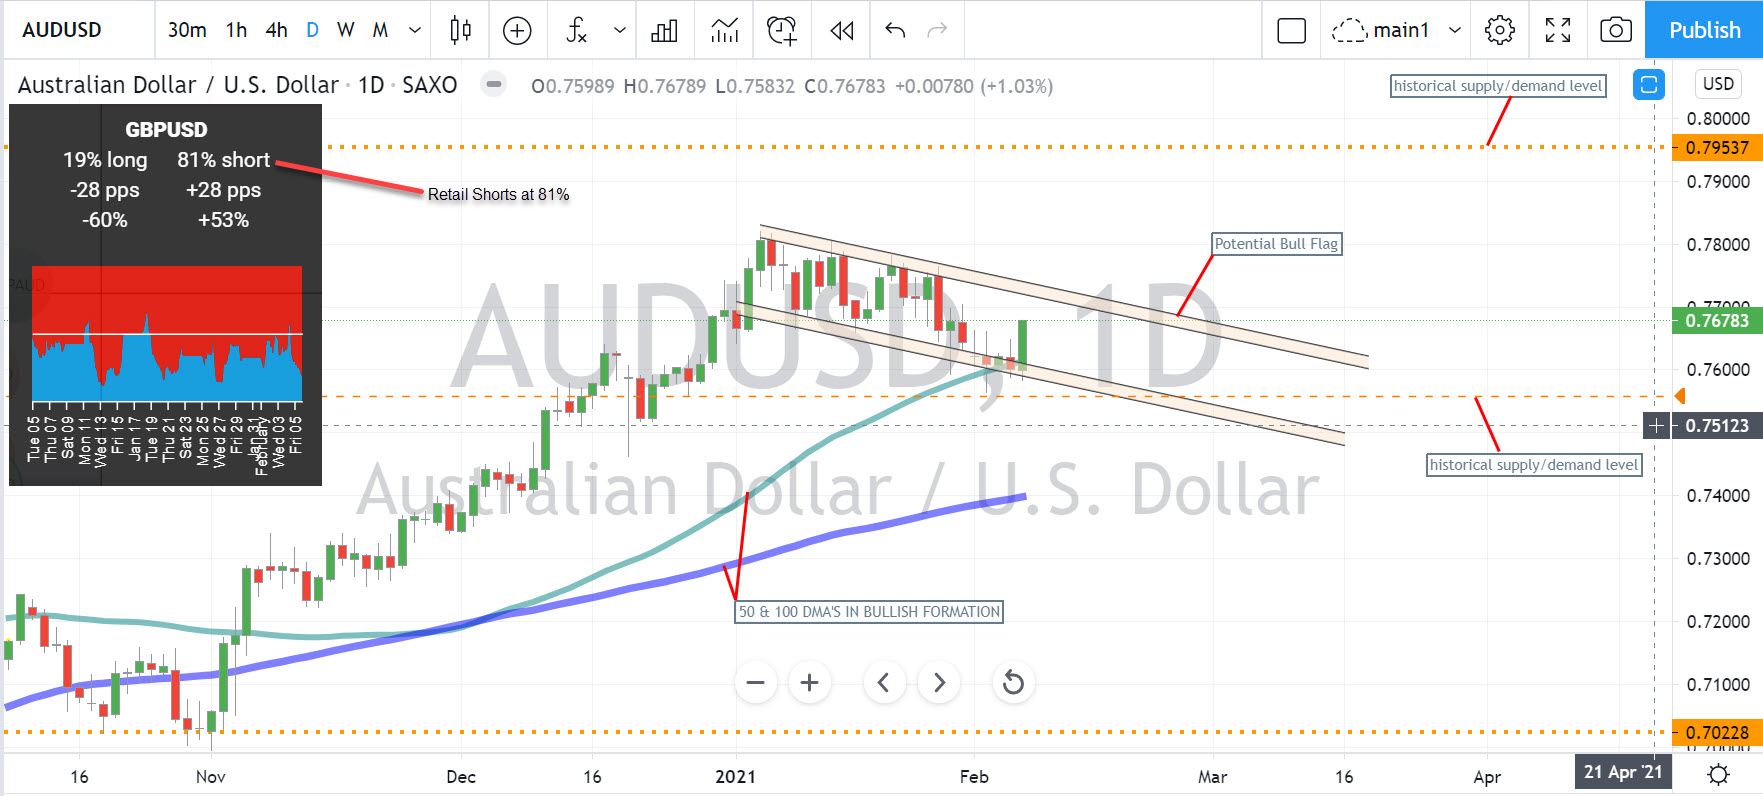
This is my analysis of the AUDUSD pair using SentiFX tools to understand how retail is currently positioned and how we may exploit this positioning to effectively take the other side of the 90%+ losing retail traders and bank some pips in the process.
Starting with the Daily Chart you will see that the pair is in a very strong uptrend making consistent higher highs whilst retail have been trapped and adding to shorts for the whole ride up. Note that the 50 and 100 DMA's are in a very wide bullish formation indicating a persistent trend.
Recently the pair has taken time to pause and made a pullback into the uptrend making a LH and a LL in the process. however during this time the retail positioning has remained short - so, not wanting to be part of the retail 'sheeple' crowd we still want to look for long opportunities.

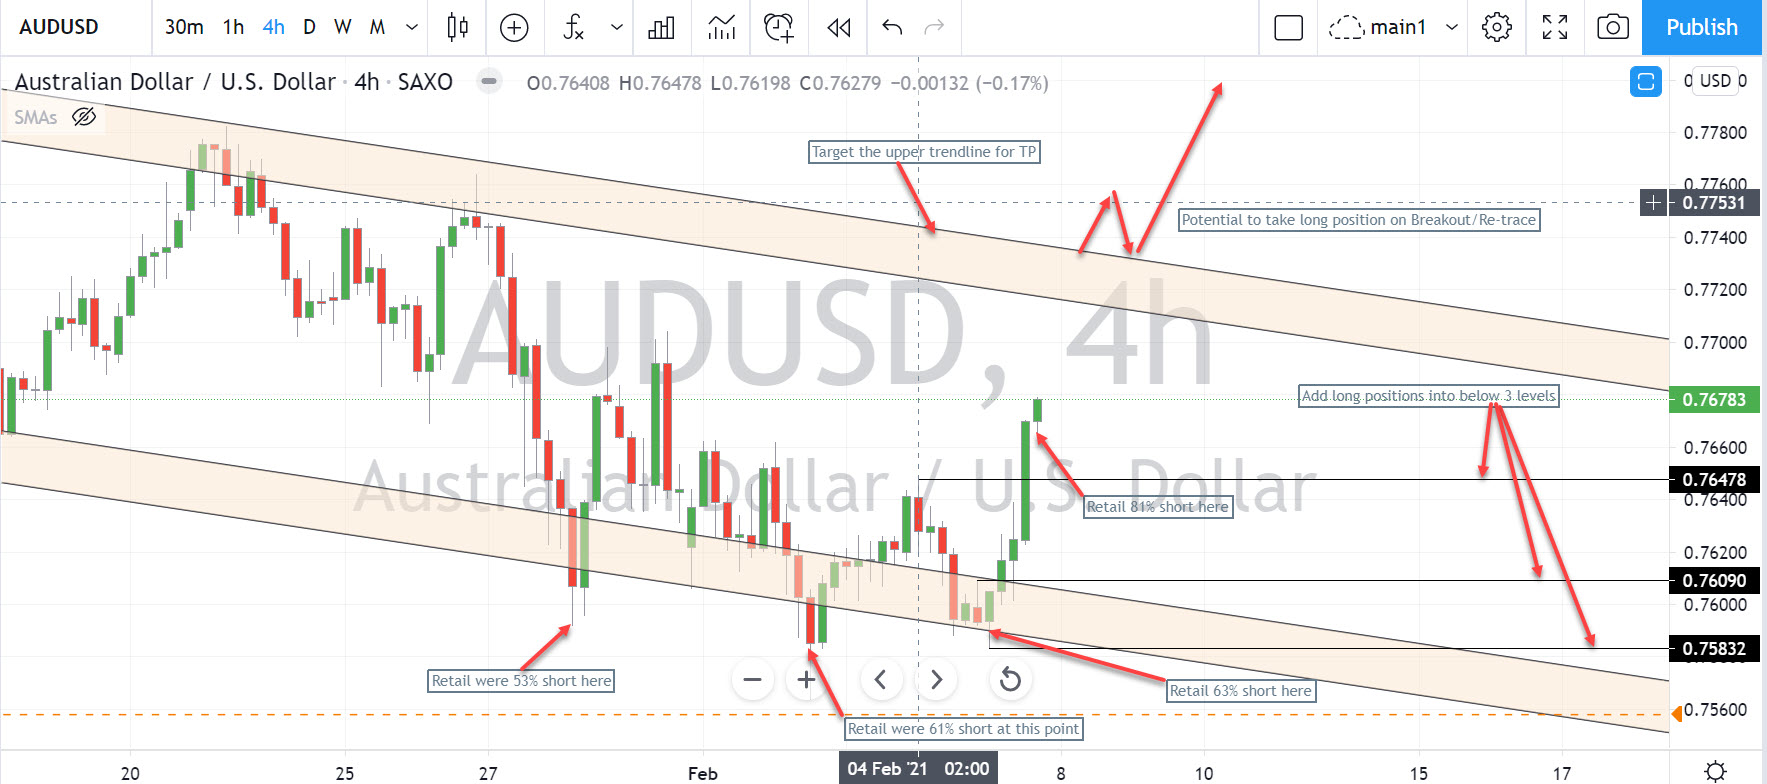
The current pullback has created what looks to be a bull flag formation. Drilling down into the 4hr chart, the resultant symmetrical trend channel has provided us with a good take profit target level in the short term, as well as an opportunity to trade long into the direction of any potential breakout so long as retail still are sitting on the short side.
I have identified 3 levels which form part of a Liquidity Gap - (LG) or put simply, a zone where unfilled orders may remain, which the Market makers may shoot for to tag and fill! If I get a fill at 1, 2 or all 3 of these levels I will target the top of this channel for TP.
Setups like this occur daily and can be easily identified using the suite of indicators (including MT4) provided by the SentiFX team.


Leave A Comment