Happy New Year Traders! Let's make 2020 the BEST Trading Year!!
Before we begin, I just want to thank you for being part of the SentiFX community. There are some big plans for 2020.
We're going to develop some Trading Drills to help you hone your Analysis Skills in all areas of the SentiFX Methodology.
We're also going to develop indicators for the MT4 platform that allow you to see Sentiment in various perspectives directly on your charts.
We will continue to develop the Sentiment Analysis Suite of Tools and we expect to complete the Market Structure Deep Dive Course and much more!
Of course, all of this is FREE to current members.
Now, let's get to the most important part - let's look at some charts to see how we can make some money.
Sentiment
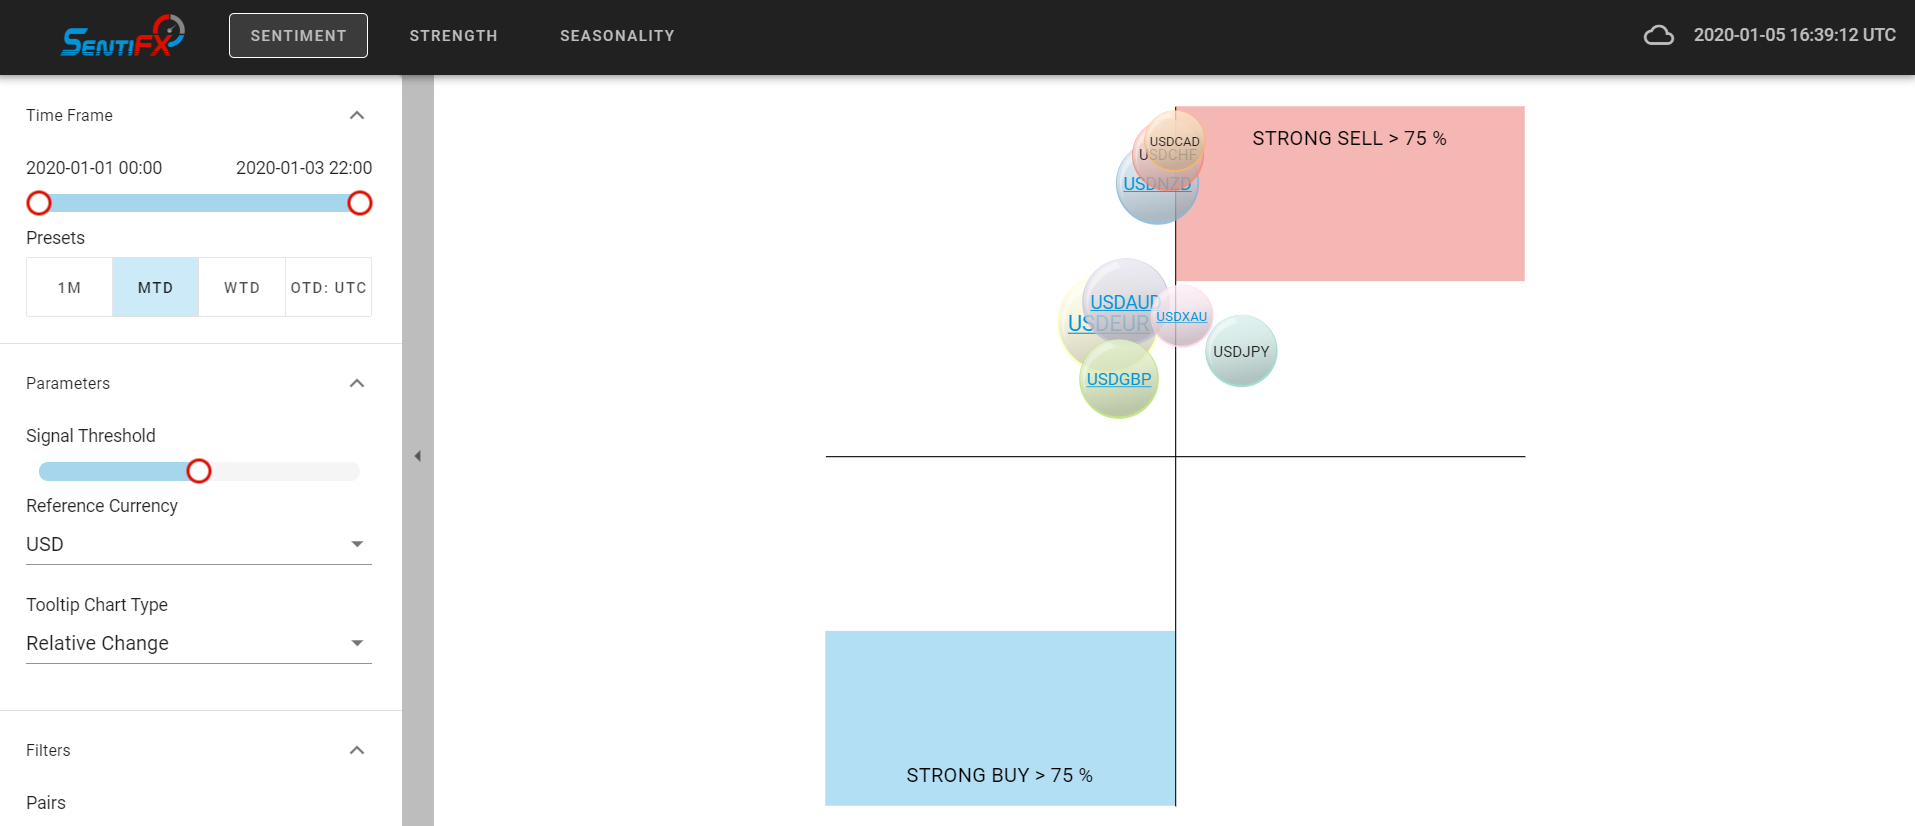
Using USD as a Base Currency (USD/xxx) we are able to analyze and isolate the Sentiment of the USD.
Currently with Sentiment - USD is a SELL as all USD pairs are above the X axis.
This means that more retail are LONG USD.
We want to watch for the bubbles to move higher towards strong sell and target all the weaker quote currencies.

Seasonality
CAD is the Weakest Pair in January
CHF & JPY are the Strongest.
I like to see JPY align with CHF as they are Risk Off Currencies.
EURUSD
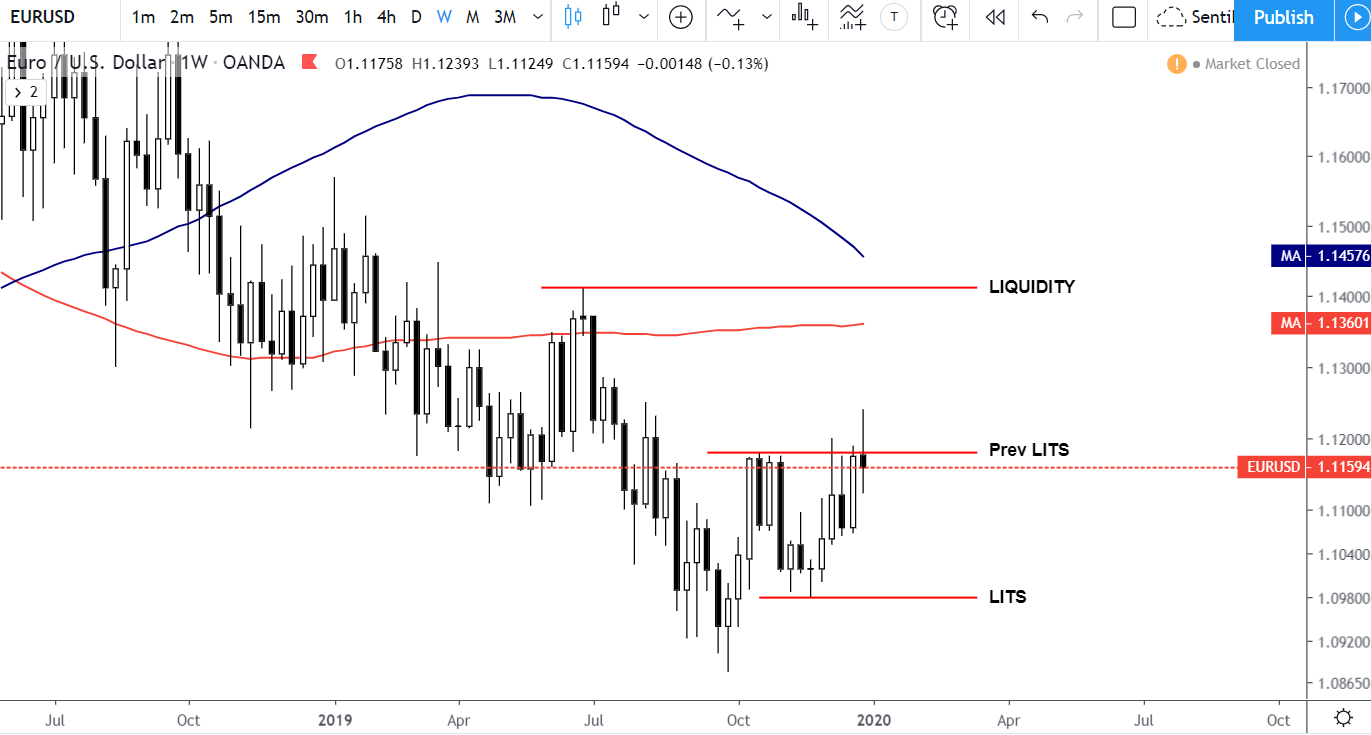
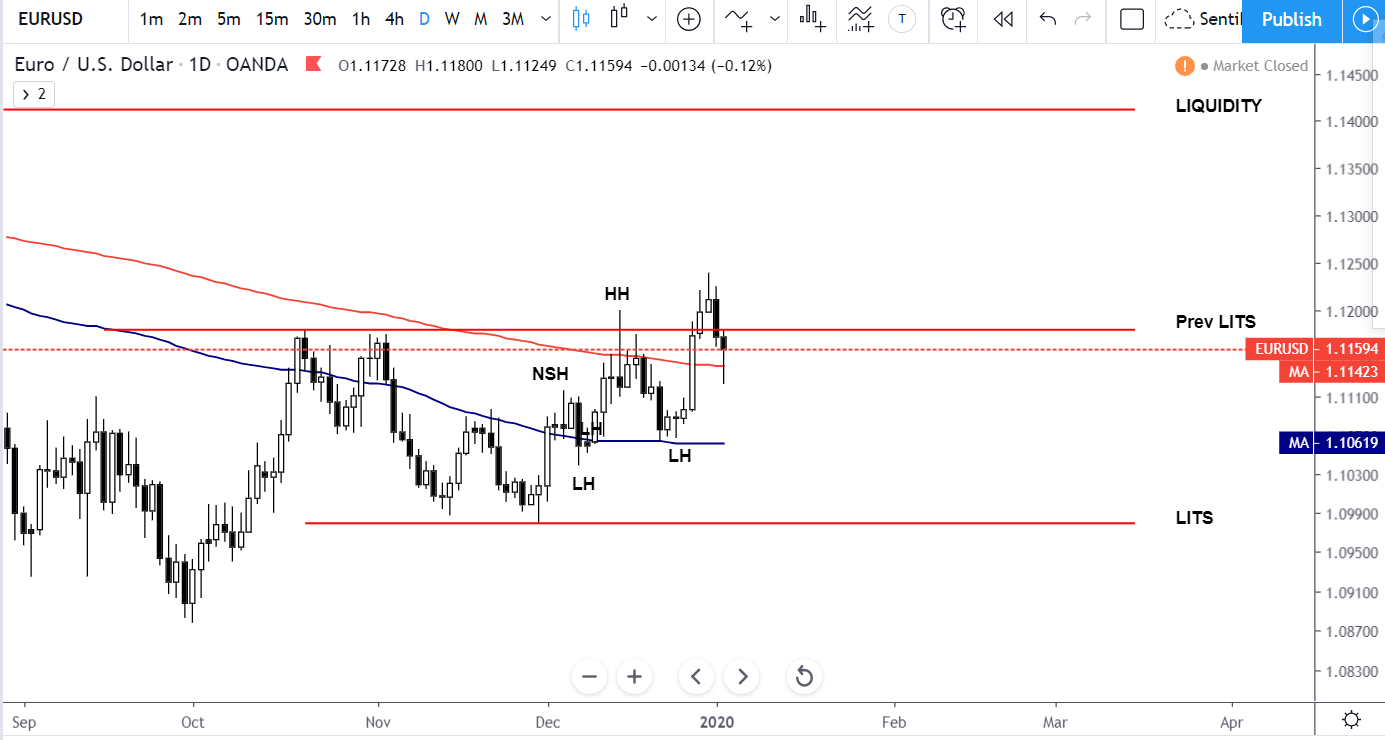
We can see that EU crossed the Line in the Sand to the upside on the weekly chart. I don't neccessarily like seeing a close below, however when we look at the Daily Chart - we can see structural build to the upside.
Look for Buying Opportunities.
USDJPY
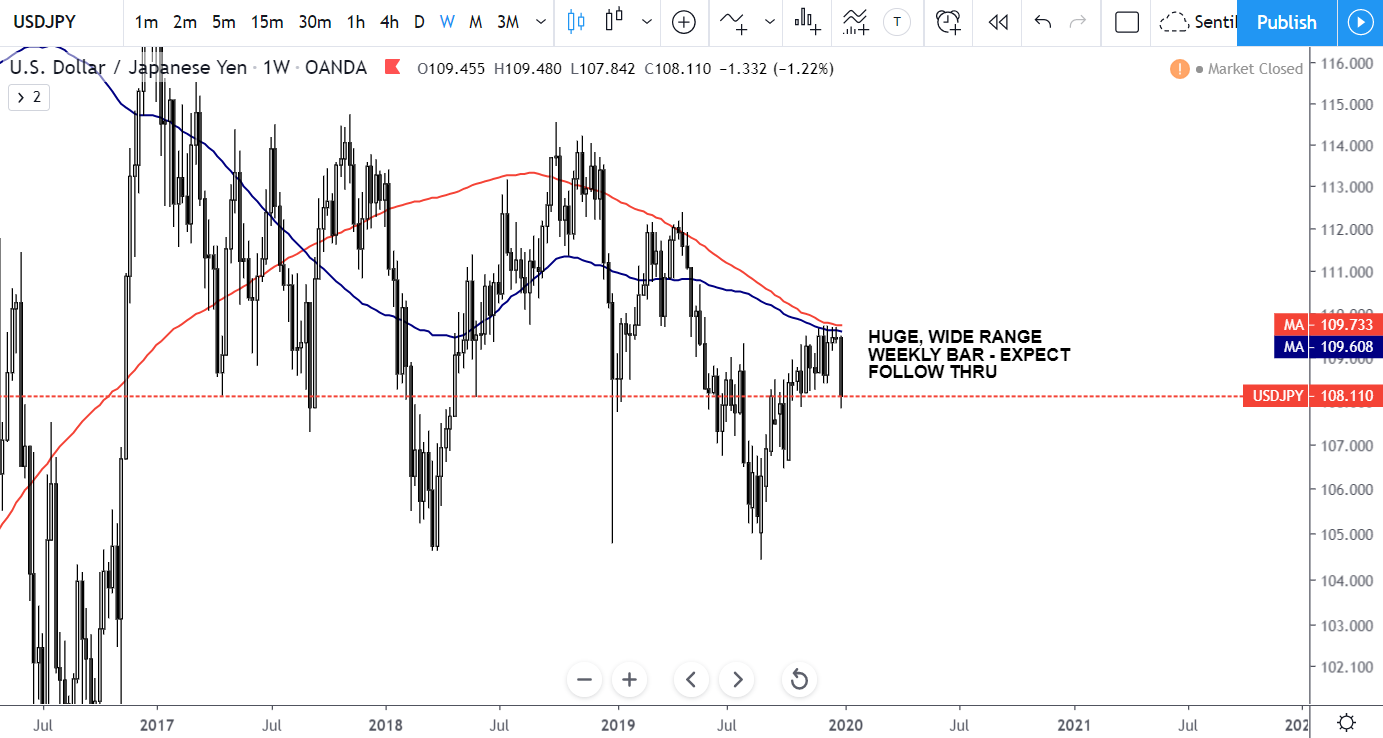
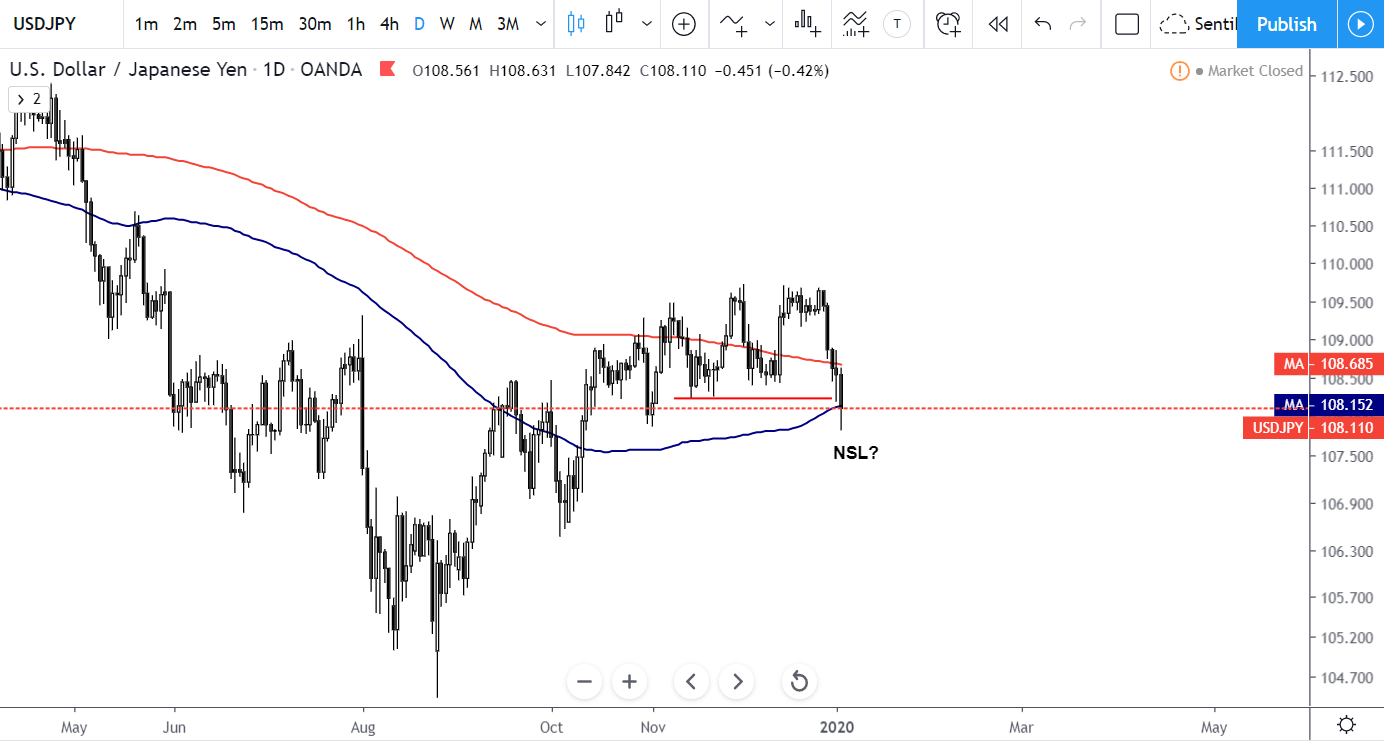
UJ is very interesting for me. As part of the SentiFX Methodology - we like trades where many stars align.
UJ has these stars on the SELL SIDE.
Seasonally JPY is stronger in January.
USD is currently a SELL as a basket.
On the Weekly Chart - we have a HUGE - Wide Range Bar to the SELL SIDE.
On the Daily we have a NSL.
The Red MA is above the Blue MA on both the Weekly and Daily.
SO Many Stars are saying - SELL SELL SELL.
USDCAD
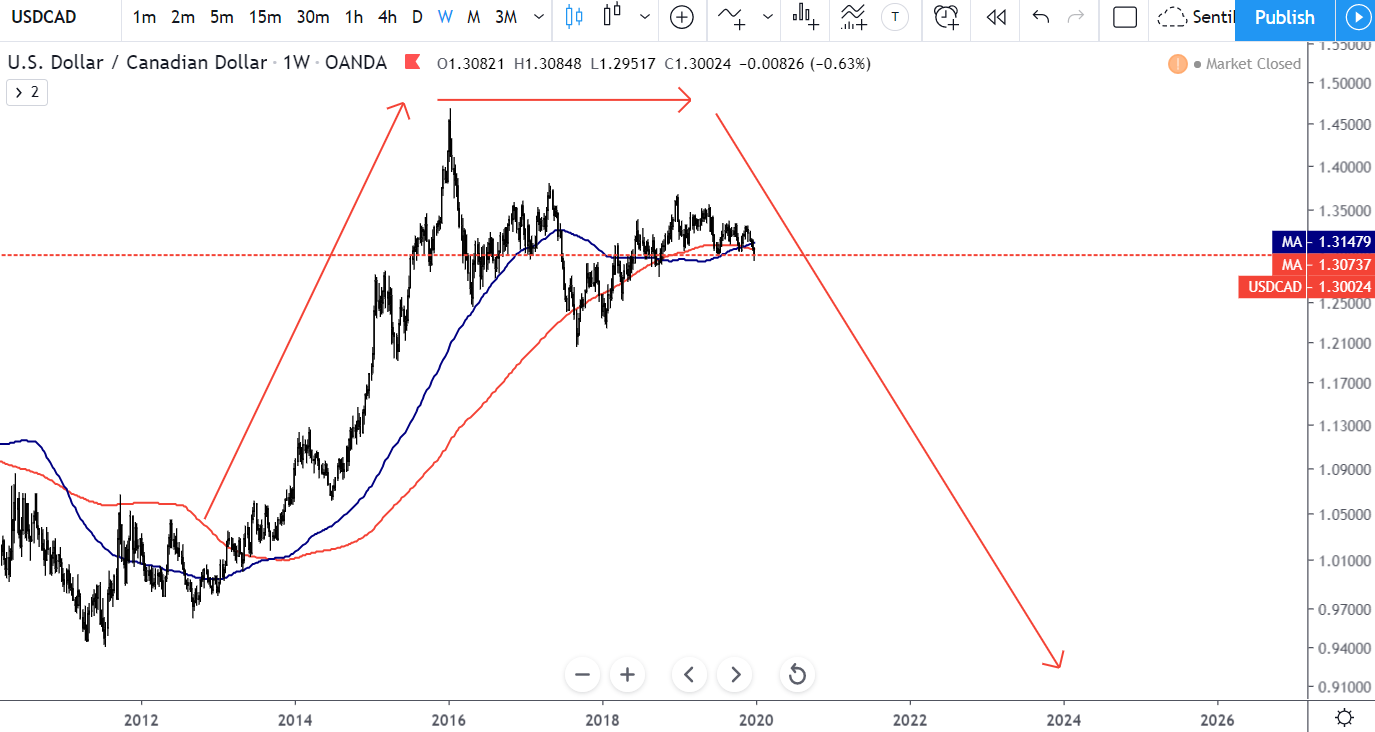
UC so far seems to be playing out on the higher timeframe as a Market Cycle. We're expecting price to work it's way down over the next few years.
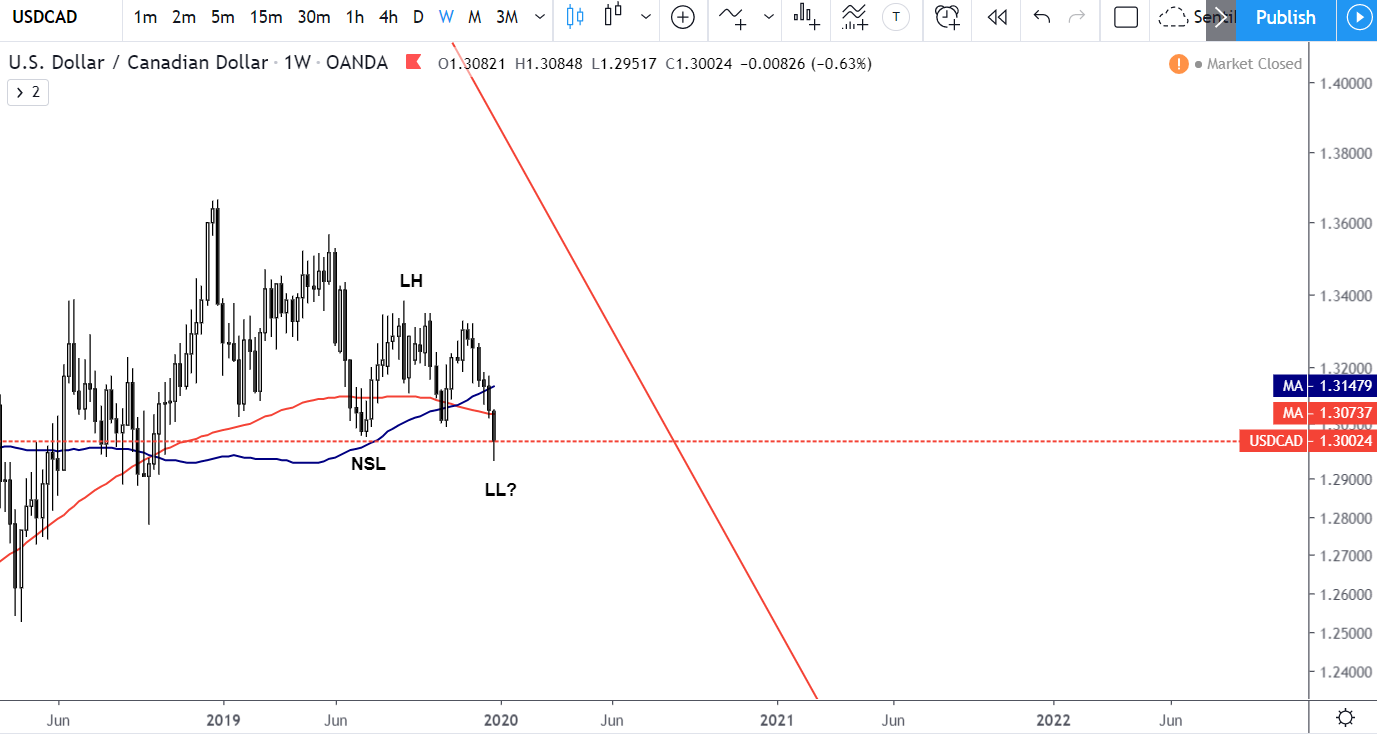
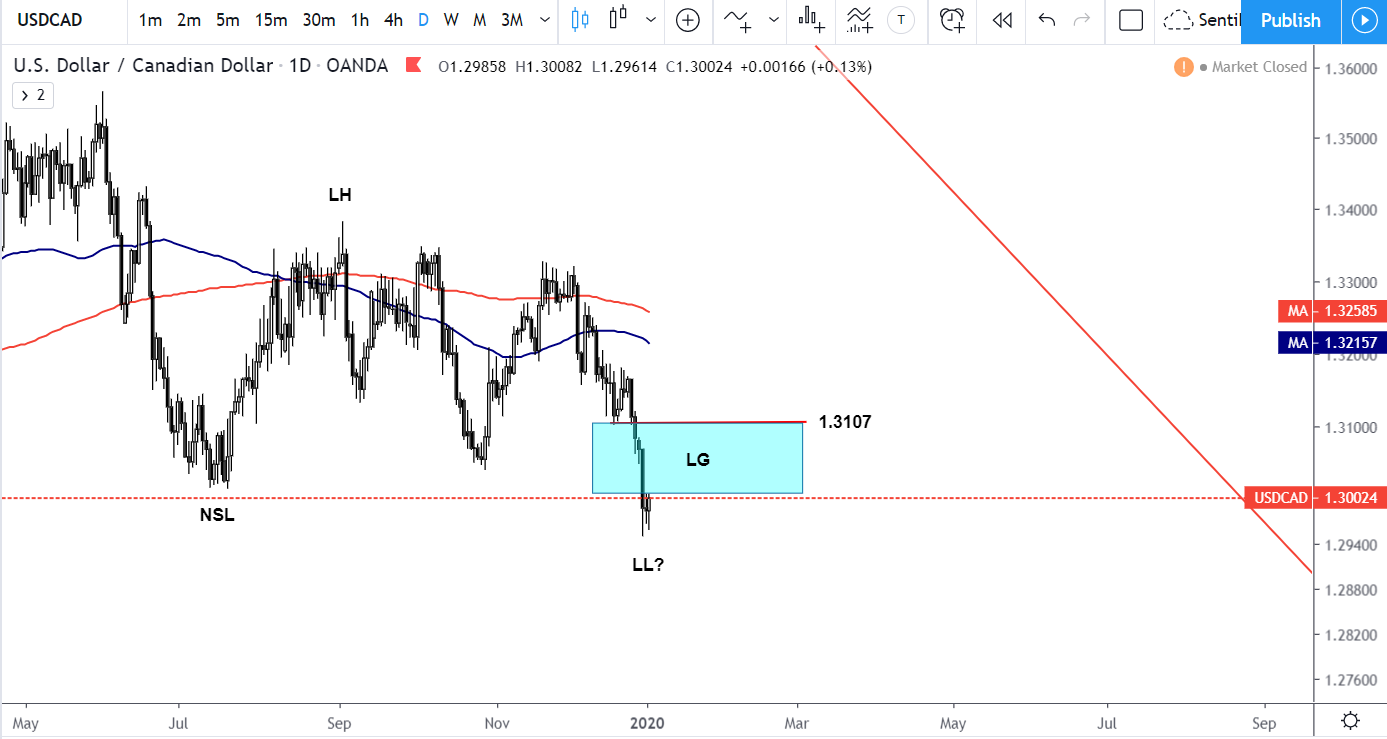
Structurally - UC is making LL's on the Weekly and a NSL on the Daily Timeframe.
There is a Liquidity Gap that may get filled before another move down.
Seasonally, CAD is weak in January - so betting on a downward move would go against statistics.
All of the other indicators point at a downward move. So if you want to sell, enter with caution.
Personally - the smarter play is to wait for the LG to mostly fill then enter short.
GBPUSD
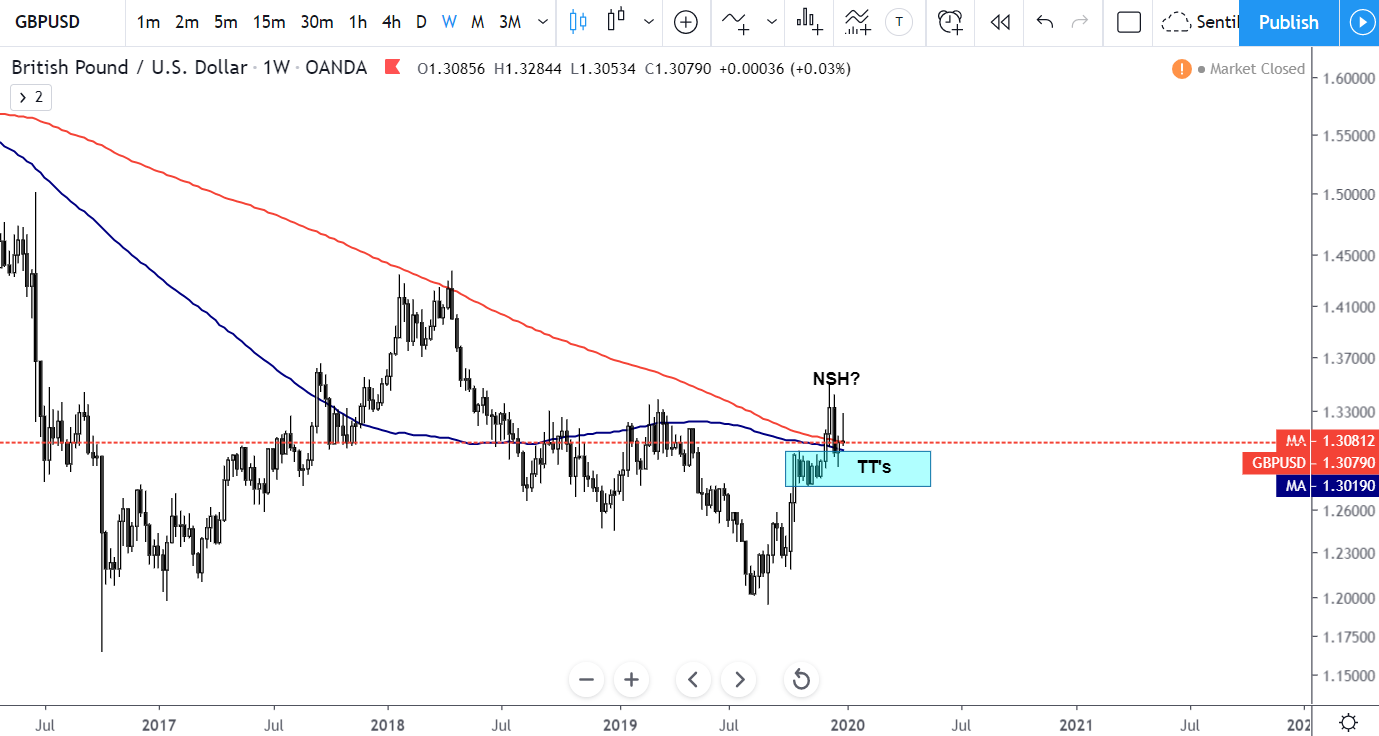
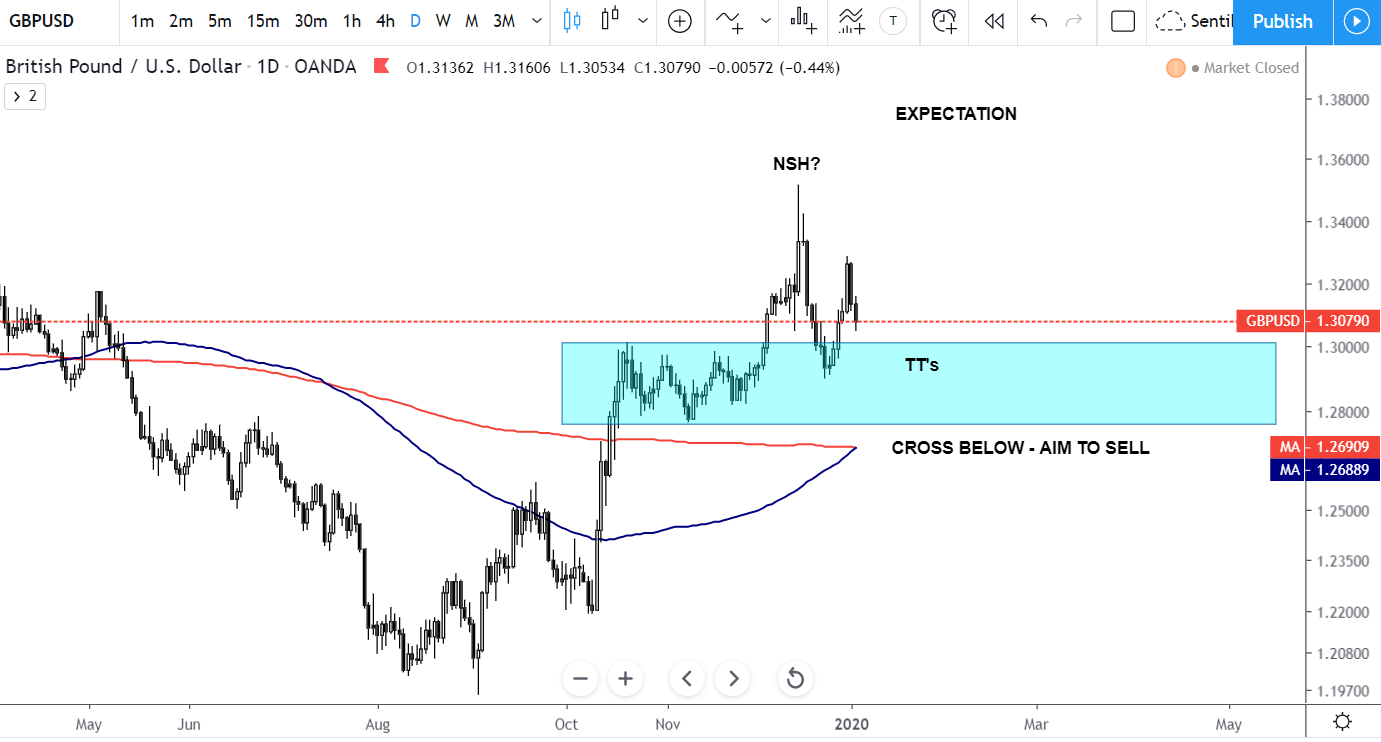
GU has made a structural break to the upside and is currently reacting at Trapped Traders as expected.
The expectation is for a move upward to break the recent NSH?
However - if price moves strongly below the Trapped Trader zone - enter short on a pull back targeting stops.
The Sentiment showing Short USD and Structural Alignment with GBP points to an upward move.
AUDUSD
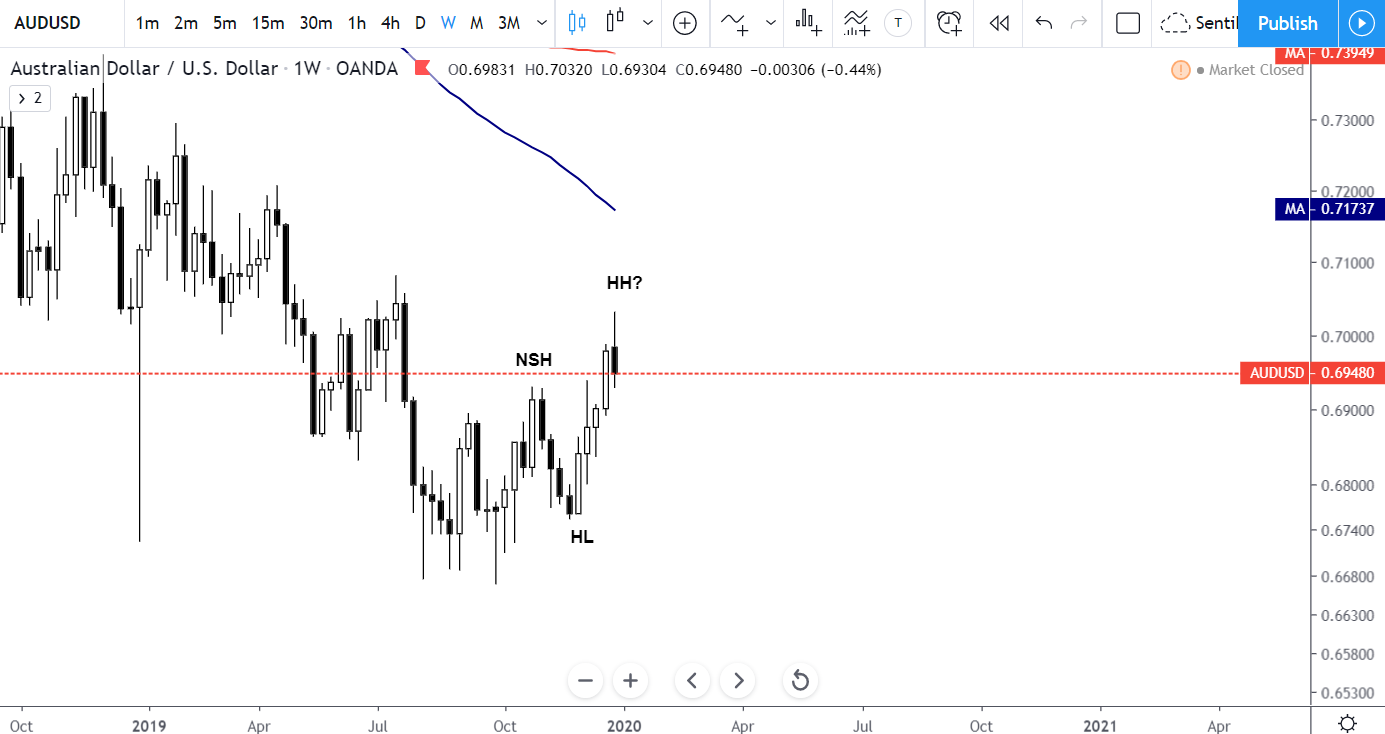
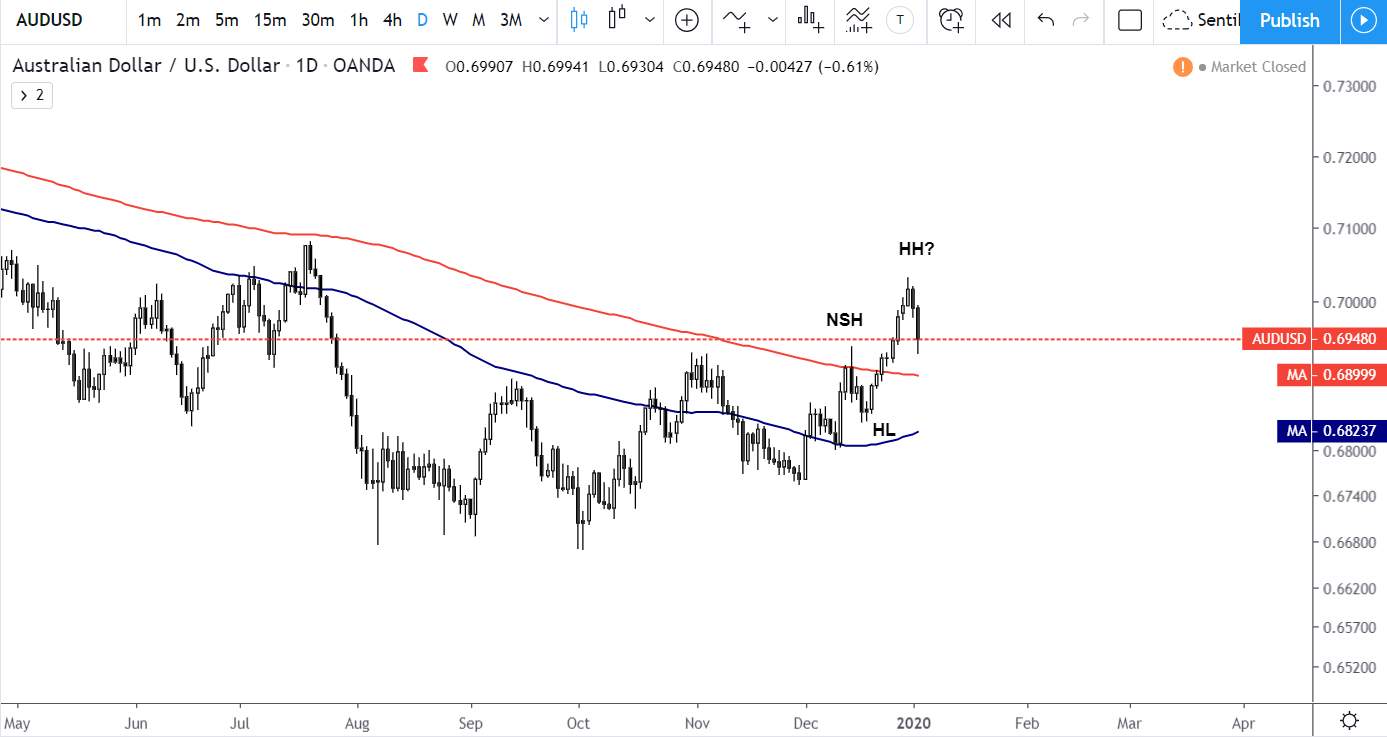
AU has changed gears recently. It seems the sell off has changed as price builds upward.
I expect the pair to continue upward as strength is to the upside as well as Sentiment showing USD weakness.
NZDUSD
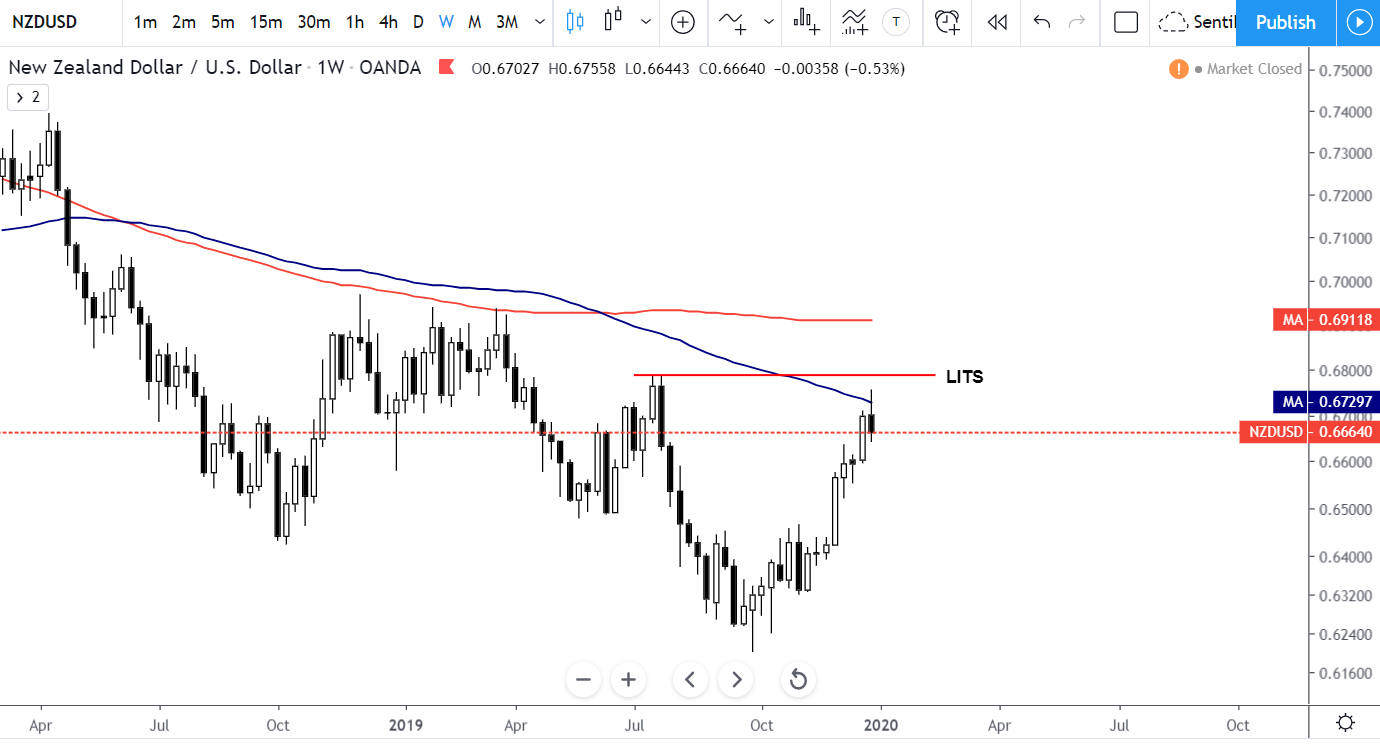
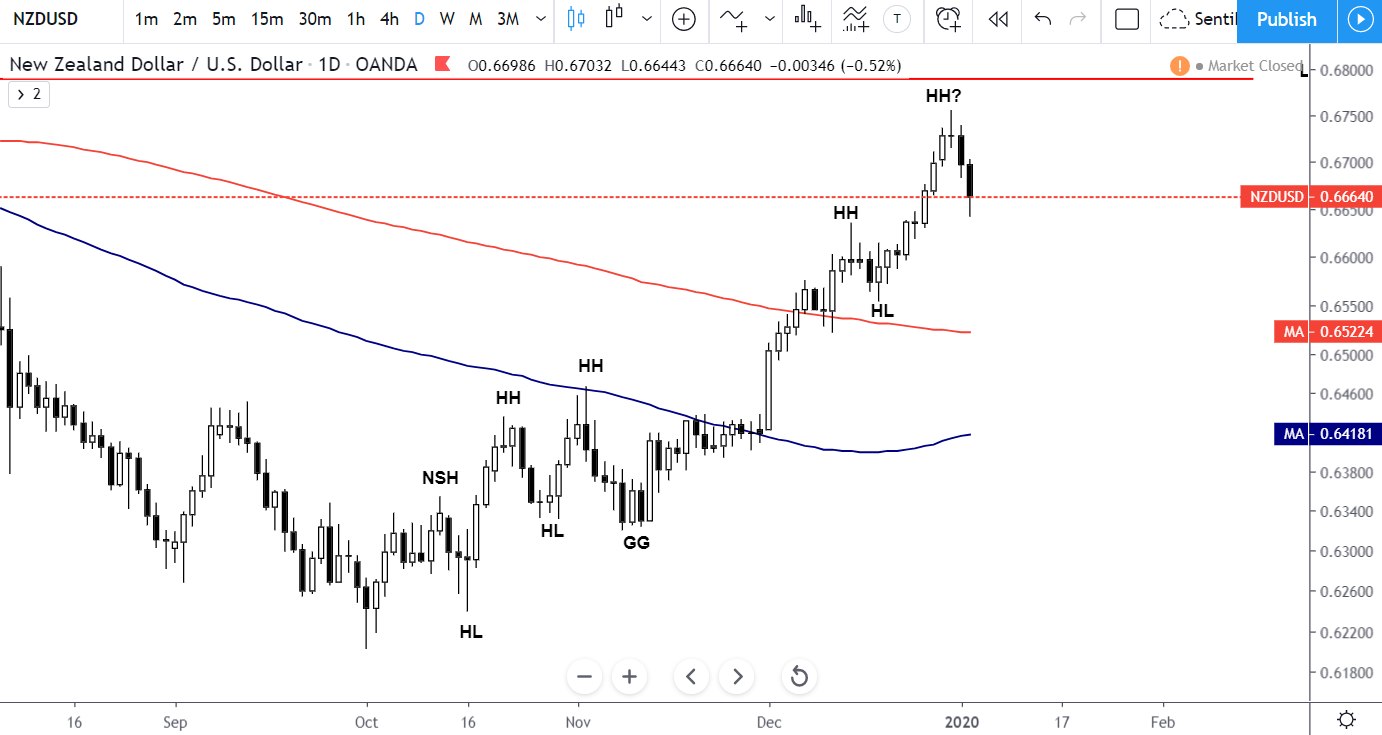
NU has not broken the LITS to the upside on the weekly chart - but the Daily chart has been on a roaring uptrend.
I would look for price to pull back to Trapped Traders before expecting a continuation upward.
USDCHF
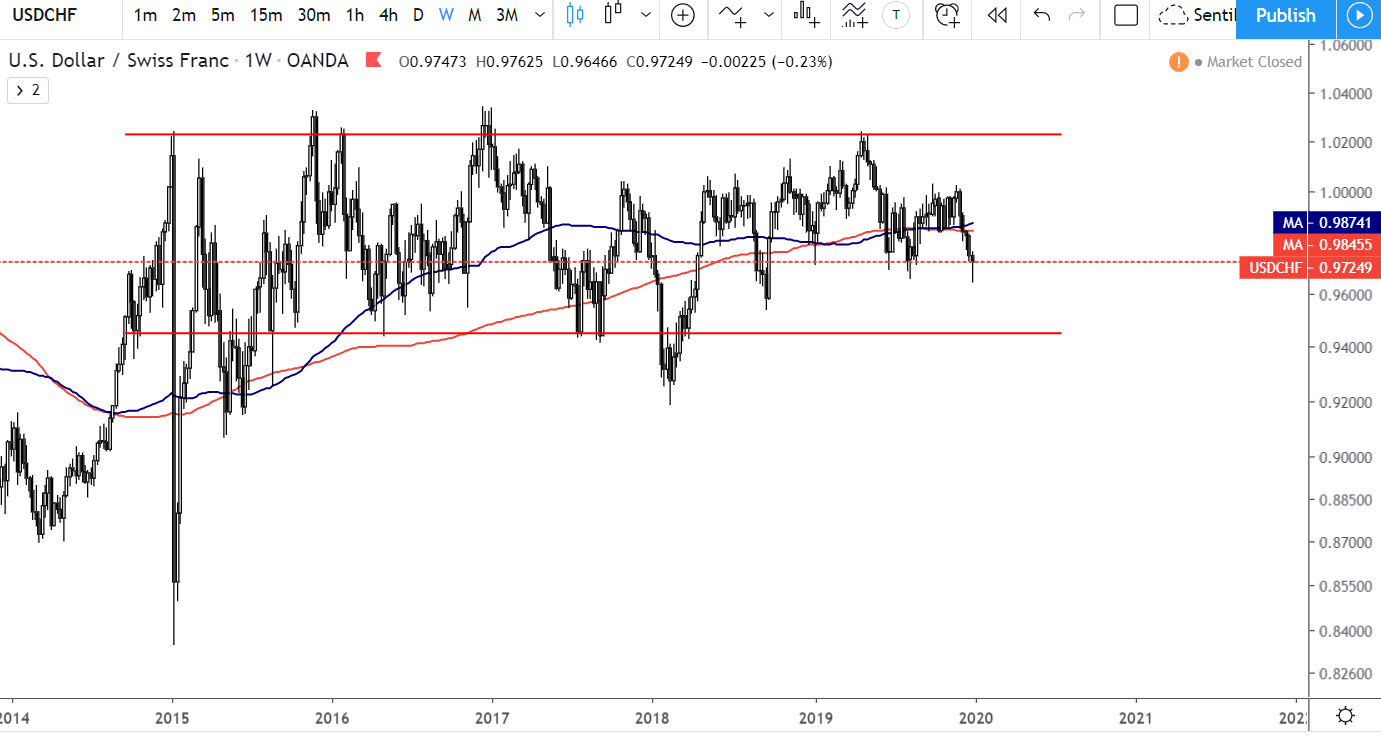
USDCHF is in a huge range on the Weekly Chart.
These types of charts can be dangerous to trend followers.
The seasoned trader will aim for stops for Trapped Traders and Stops for entries.
Seasonally USDCHF is a sell, however I wouldn't sell here as stops have been taken. If you want to enter short - Target Trapped Traders and aim for Stops. Keep your sights on the Daily/Weekly Stops to exit.
That wraps up the Analysis for the start of 2020. The strongest play here is UJ Short.
Keep an Eye on Sentiment and Market Structure to guide your trading decisions.
Trade with Edge, Trade Well -
Charles

Leave A Comment