Track Retail Sentiment
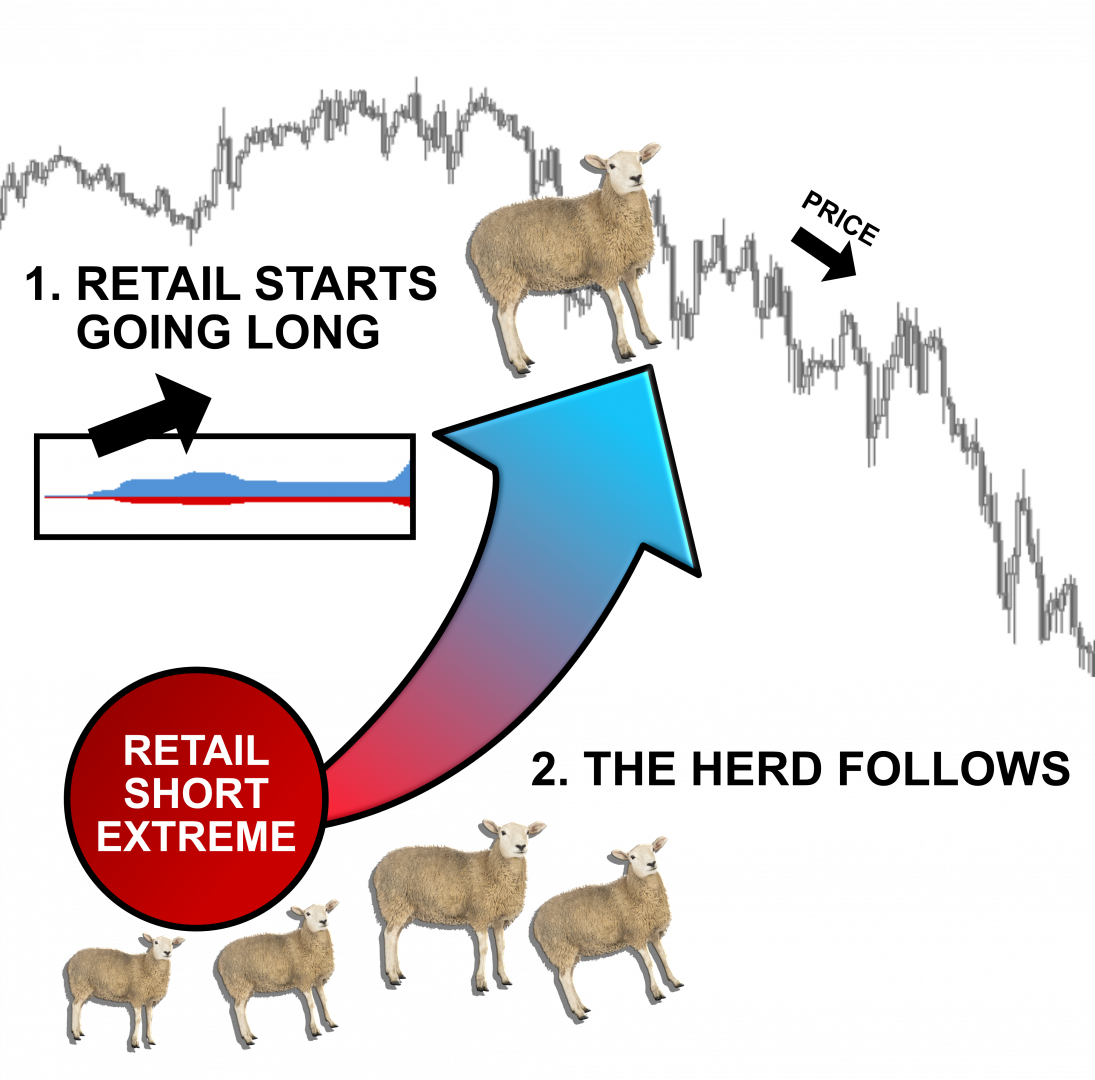
Trade Against the Herd for Profit
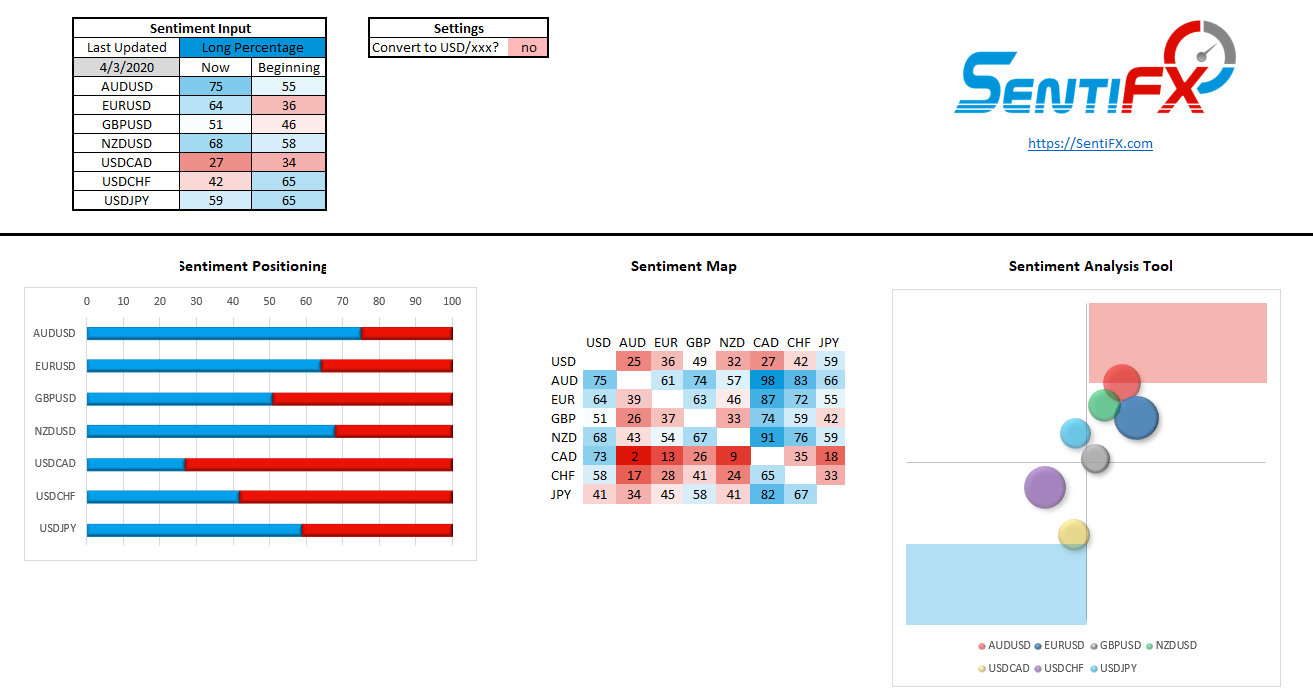
Sentiment Analysis Spreadsheet
Tired of Losing Money Trading?

Tired of Losing Money Trading?
First, you have to ask - why are you trading in the first place. Are you in a frustrating or boring day job and want financial freedom? Maybe you're just looking for some extra money on the side. You've probably experimented with different ways of trading by now and haven't had much success.
We know that 90-95% of retail traders lose money.
What if I told you that you can trade profitably and consistently by having a directional bias opposite of retail traders and with the direction of Market Makers?
If you want to achieve your trading goals, you need the added edge of Sentiment to help you in your journey.
Now you can win more trades and make more money.
Quickly Focus on Key Pairs
Quickly Focus on Key Pairs
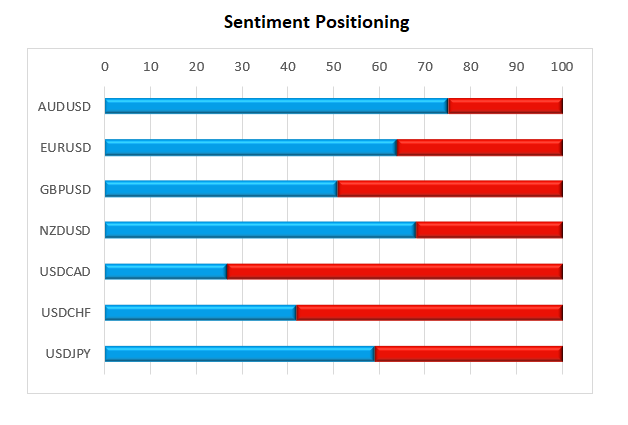
You'll quickly be able to see if retail is MORE long a pair or MORE short a pair.
Our rule of thumb is retail positioned over 75% LONG is a SELL Signal and retail positioned less than 25% LONG (or 75% short however you look at it) is a BUY signal.
You'll quickly be able to see if retail is MORE long a pair or MORE short a pair.
Built in Signals
Built in Signals
When a Sentiment Bubble Moves into the Blue Rectangle - That's a BUY signal.
When a Sentiment Bubble Moves into the Red Rectangle - That's a SELL signal.
Doesn't get much simpler than that.
When a Sentiment Bubble Moves into the Blue Rectangle - That's a BUY signal.
When a Sentiment Bubble Moves into the Red Rectangle - That's a SELL signal.
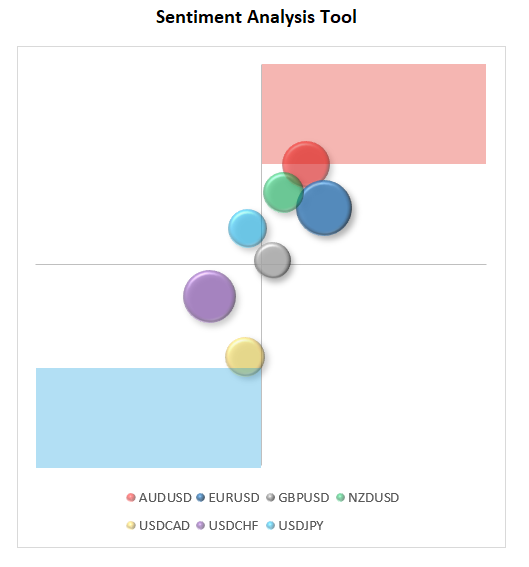
Doesn't get much simpler than that.
Sentiment Heat Map
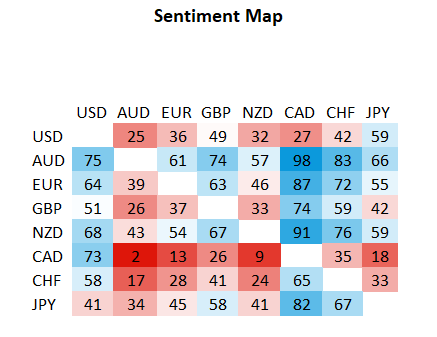
Sentiment Heat Map
Quickly see which pairs to focus on.
Say we want to look at AUDUSD. Start by going down the left column until you see AUD... then go across the top row until you see USD.
Retail is 75% LONG in AUDUSD. Easy huh?
Retail is 75% LONG in AUDUSD. Easy huh?
Easy Basket Analysis
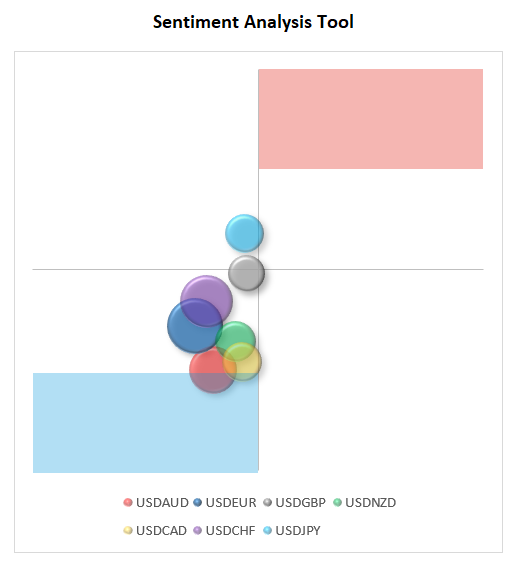
Easy Basket Analysis
Want to know how retail is positioned in all currencies AGAINST the USD?
Now you can with Basket analysis.
Are the bubbles clustered around the BLUE rectangle? then USD is a BUY.
Are the bubbles clustered around the RED rectangle? then USD is a SELL.
Proven Edge by Quantitative Analysis
We did a deep dive using quantitative analysis to see if Sentiment Trading had edge. The results were in line with what we expected.
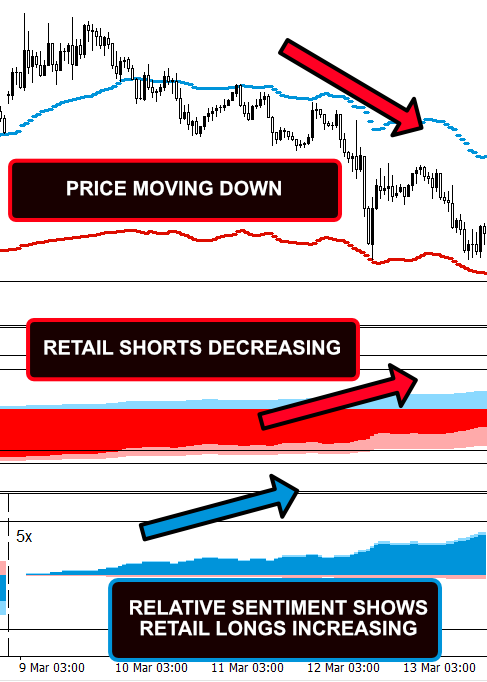
The Results? Price moves opposite to the retail herd.
Look at the image to the right - it doesn't take a rocket scientist to see that when retail was Shorting (red background) price moved up and when retail was going Long (blue background) price moved down.
Proven Edge by Quantitative Analysis
We did a deep dive using quantitative analysis to see if Sentiment Trading had edge. The results were in line with what we expected.
The Results? Price moves opposite to the retail herd.
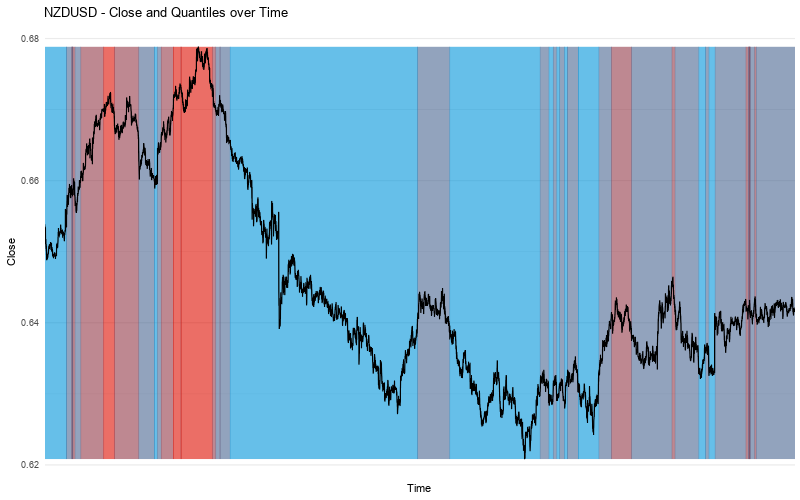
Quantitative Analysis done using the statistical analysis environment R
Look at the image above - it doesn't take a rocket scientist to see that when retail was Shorting (red background) price moved up and when retail was going Long (blue background) price moved down.
Who is Sentiment Trading for?
Traders who believe the Market is Manipulated and want to be on the side of the Market Manipulators.
Traders who know that most retail lose and want to take trades opposite of the retail herd.
Traders who want more confidence taking their trades and holding on longer for bigger profit.
Access a Trading Community
You get more than the Powerful Sentiment Analysis Tools, Indicators, and Education.
You also get access to other Traders who
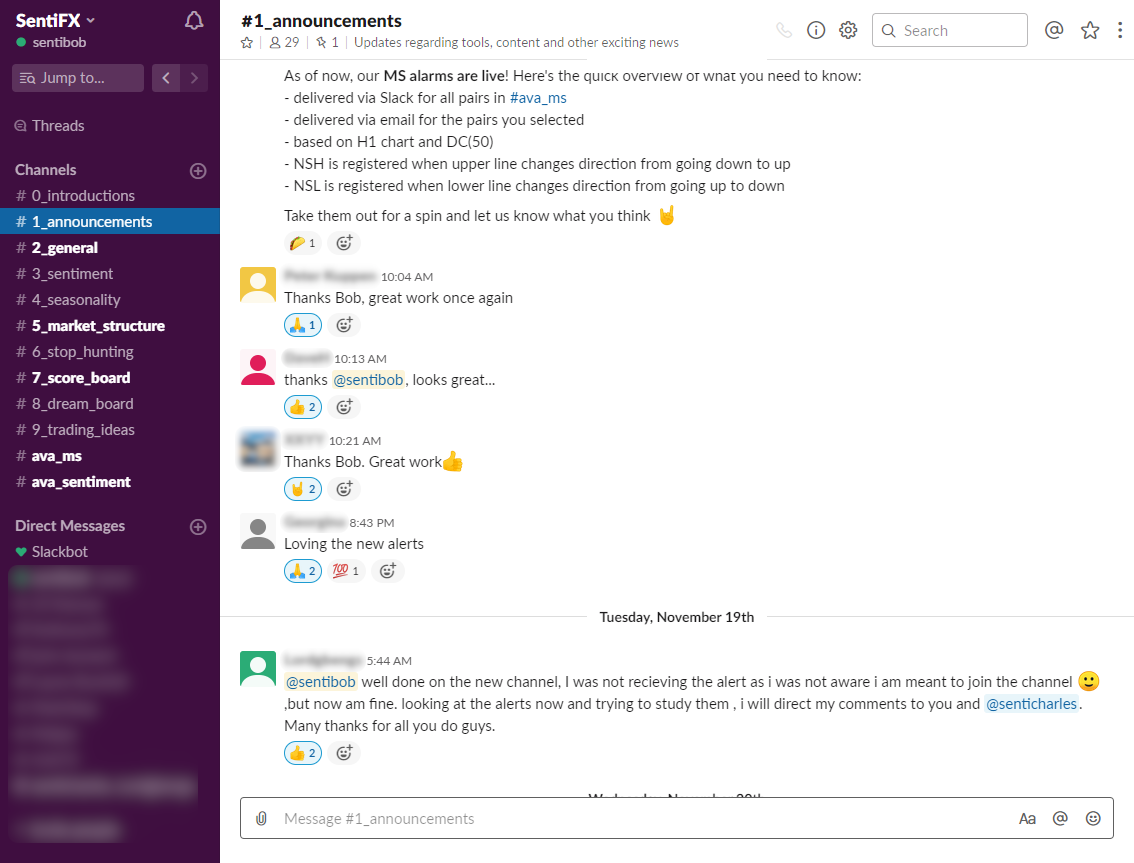
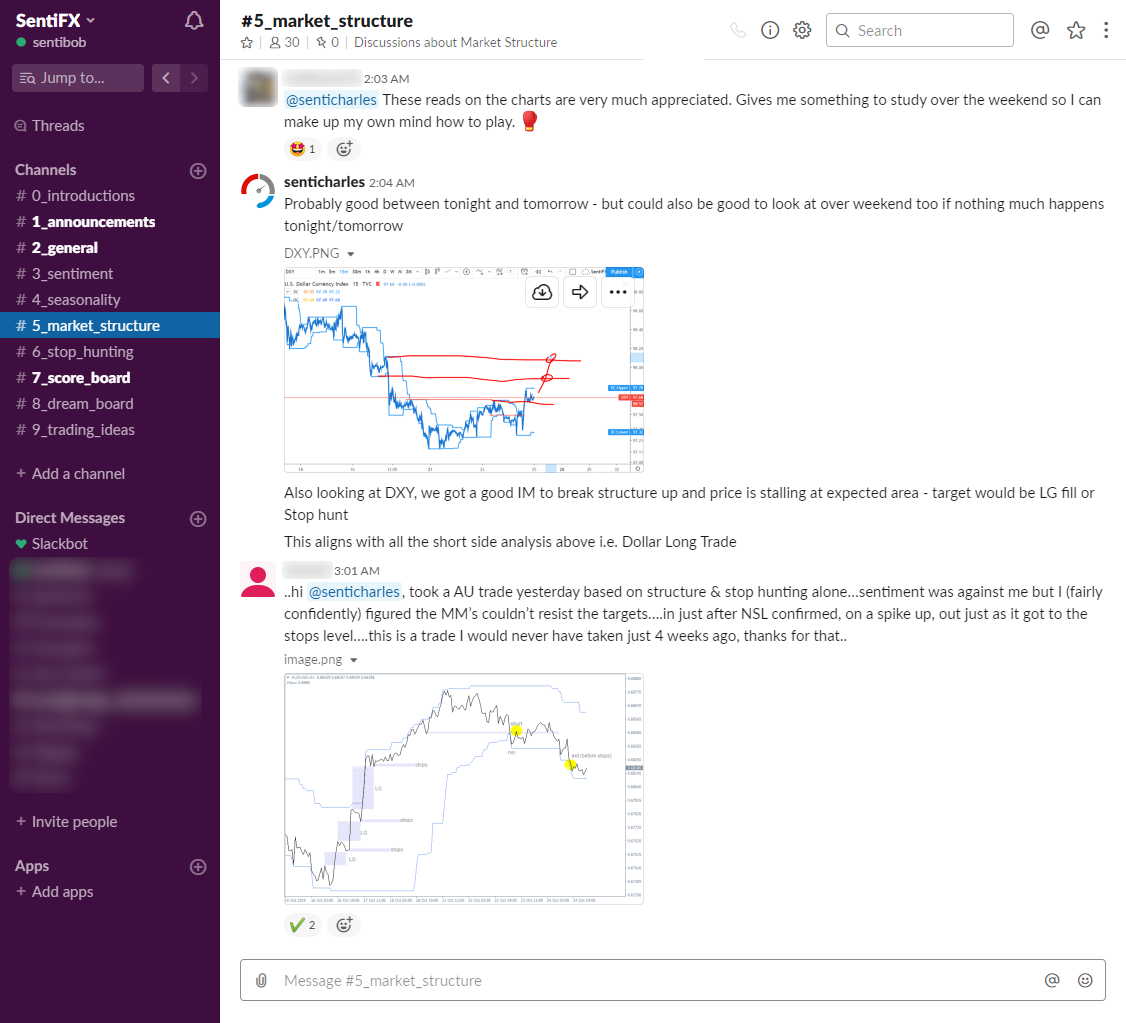
use the Edge of Sentiment every day on Slack.


Start Tracking Retail Positioning
Sentiment Analysis Excel Spreadsheet
Lifetime Access
$57 $17
lifetime access - single installment

